India Hotels, QSR & Tourism — sector deep-dive
India hospitality is a supply-starved up-cycle: branded-room demand compounding 10.4% against 7.7% supply — just…
01Executive summary
India hospitality is a supply-starved up-cycle: branded-room demand compounding 10.4% against 7.7% supply — just 4.6% in metros — and a quality hotel takes 5-7 years to build, so the gap holds through FY28 at minimum. FY26 proved the pricing power end-to-end: IHCL's record ₹9,971 cr (+16%), Oberoi's ₹17,696 ARR at 79% occupancy, luxury EBITDA margins of 35-48%. Crucially the engine is domestic — 73-75% of room nights — because foreign arrivals actually FELL 9.4% in 2025; weddings, MICE and spiritual tourism (Ayodhya: 164mn visitors) do the heavy lifting. QSR is the adjacent turn: after 14 quarters of value-war attrition, Q4 FY26 delivered the first broad SSSG improvement. Travel-tech splits into B2B compounders (TBO, RateGain) and a B2C tier where one player is visibly failing. The cycle's expiry date: the FY29-30 supply wave, when 78% of today's pipeline opens at once.
Why now
- The supply gap is physics, not forecast: 114k pipeline rooms take 5-7 years to open, locking rate-led RevPAR growth through FY28 while system occupancy still sits below 70%
- QSR's inflection is dated and measurable — Q4 FY26 gave the first broad SSSG improvement in 14 quarters (Devyani KFC +4.9%, Westlife +1.5%, BK +4%) with the value war cooling.
- H2 FY27 stacks the calendar: dense wedding dates, festive season, and BRICS-2026 MICE compression nights in gateway cities.
Key risks
- The FY29-30 supply wave: 78% of the announced pipeline is under construction and opens in a narrow window — metro RevPAR compression is a when, not if.
- Domestic air capacity (+1.9% pax growth in FY26) is the sector's circulatory system — engine groundings and delivery delays cap how many travellers reach the lobby.
- QSR's turn is one quarter old — a value-war relapse or discretionary pause would trap the chains at thin four-wall economics with expansion bills due.
02The demand engine
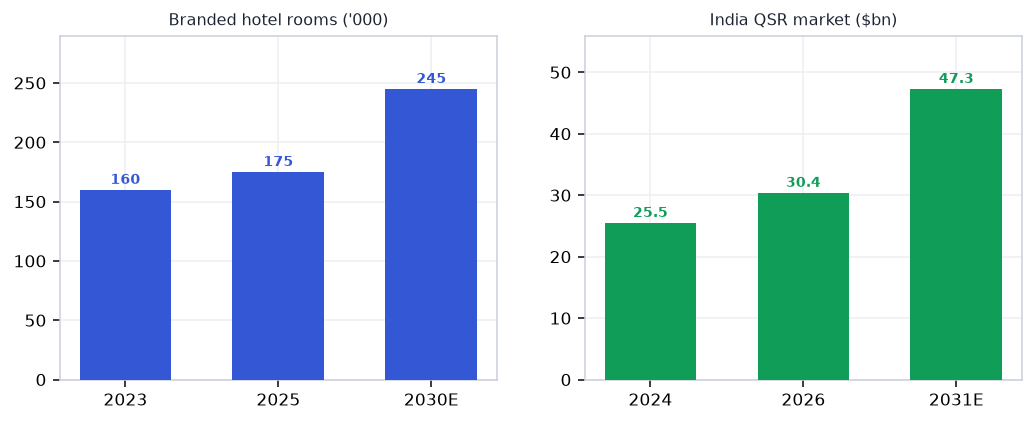
Where the demand comes from — the structural drivers pulling the sector's order books.
Unlock the full Hotels, QSR & Tourism report
8 more sections — the graded universe, scenario analysis, institutional flows and the downloadable fund-grade PDF.
₹399/month · every sector report + Orion queries · cancel anytime · Already a member? Sign in
Frequently asked questions
How big is India's Hotels, QSR & Tourism opportunity in 2026?
India hospitality is a supply-starved up-cycle: branded-room demand compounding 10.4% against 7.7% supply — just… The key numbers that frame the sector: 10.4% vs 7.7% (Branded-room demand vs supply CAGR (metros: 4.6%)); ₹9,971 cr (IHCL FY26 — record; RevPAR ₹11,750 (+9.3%)); 35–48% (Luxury hotel EBITDA margins at cycle highs); −9.4% (FTAs CY25 — the engine is domestic, not inbound); +4.9% (Devyani KFC SSSG — best in 14 quarters; QSR turning). On the demand side, Industry ADR stands at >$100 — crossed ₹8,525 (+5.8%) — rate-led RevPAR. Together these define both the size of the Hotels, QSR & Tourism profit pool and the pace at which it is compounding — the full report maps where along the value chain that value actually lands.
What is driving growth in India's Hotels, QSR & Tourism sector?
The supply gap is physics, not forecast: 114k pipeline rooms take 5-7 years to open, locking rate-led RevPAR growth through FY28 while system occupancy still sits below 70%. QSR's inflection is dated and measurable — Q4 FY26 gave the first broad SSSG improvement in 14 quarters (Devyani KFC +4.9%, Westlife +1.5%, BK +4%) with the value war cooling. H2 FY27 stacks the calendar: dense wedding dates, festive season, and BRICS-2026 MICE compression nights in gateway cities. Each of these drivers is tracked in the report's catalyst section with dated windows, so readers can verify whether the thesis is playing out on schedule.
What are the key risks in the India Hotels, QSR & Tourism sector?
The FY29-30 supply wave: 78% of the announced pipeline is under construction and opens in a narrow window — metro RevPAR compression is a when, not if. Domestic air capacity (+1.9% pax growth in FY26) is the sector's circulatory system — engine groundings and delivery delays cap how many travellers reach the lobby. QSR's turn is one quarter old — a value-war relapse or discretionary pause would trap the chains at thin four-wall economics with expansion bills due. The full report carries an eight-item risk register scored on likelihood and severity, plus a bear-case scenario that quantifies how these risks would transmit through each node of the value chain.
Which companies are covered in India's Hotels, QSR & Tourism sector report?
The report covers 23 listed companies across the full value chain (Assets → Operators & brands → F&B → Distribution → Demand), so upstream suppliers, manufacturers and downstream distribution are all graded on the same yardstick. Names screening strongest on this objective test currently include Sapphire Foods, Westlife Foodworld, Mahindra Holidays, Juniper Hotels, Thomas Cook India. Every company named in the report links to its live VestAI stock page, and the universe table lets readers sort the full list on valuation, returns and balance-sheet quality.
How does VestAI grade Hotels, QSR & Tourism companies?
Every name in the universe is graded on cash conversion — cumulative 3-year operating cash flow measured against reported profit. This is a data classification, not an opinion: the grade asks whether reported profits actually arrive as cash, which is where accounting-quality problems show up first. The same forensic yardstick is applied across all 30 VestAI sector reports, so a grade in Hotels, QSR & Tourism is directly comparable to a grade in any other sector — and grades refresh with each quarterly data update.
Where can I read VestAI's full Hotels, QSR & Tourism sector analysis?
The free version of this page includes the executive summary, key sector numbers, demand drivers, key risks and this FAQ — enough to understand how the Hotels, QSR & Tourism value chain earns its money. VestAI Pro and Max members unlock the full report: the complete value-chain map with node economics, dated recent developments, the catalyst tracker, competitive structure, the scenario matrix with per-node impacts, the graded 23-company universe with an interactive comparison table, and a downloadable 15-page PDF edition. Reports are rebuilt each quarter on fresh filings, and all content is educational research rather than investment advice.
India's ₹25.7L cr power + transmission super-cycle through 2030 is structural — underwritten by peak-demand…
India's defence budget has crossed ₹6.81L cr in FY26 (FY27 BE ₹7.85L cr, +16%) with ₹1.86L cr capital outlay…
India ESDM market ₹3.1L cr (~$37bn) is tracking toward ₹7-8L cr by 2030, underpinned by a ₹1.91L cr PLI outlay…