India Defence — sector deep-dive
India's defence budget has crossed ₹6.81L cr in FY26 (FY27 BE ₹7.85L cr, +16%) with ₹1.86L cr capital outlay…
01Executive summary
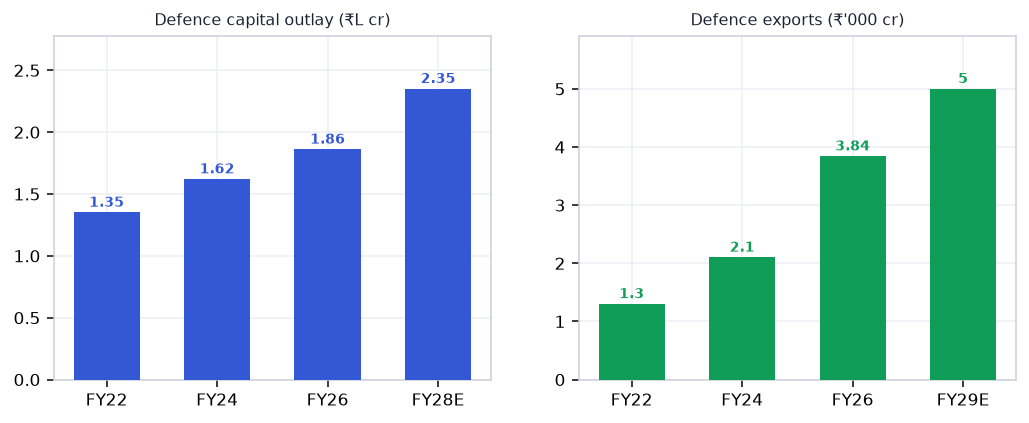
India's defence budget has crossed ₹6.81L cr in FY26 (FY27 BE ₹7.85L cr, +16%) with ₹1.86L cr capital outlay ring-fenced 75% for domestic industry — the structural indigenisation mandate has already lifted production to ₹1.78L cr and exports to a record ₹38,424 cr (+63% YoY). Durable profit pools sit in missiles & munitions, defence electronics/EW, and drones/C4ISR where EBITDA runs 25-30% and DPSU order books exceed ₹4L cr (HAL ₹2.54L cr, BEL ₹73,882 cr); naval shipbuilding and land-systems EMS provide visibility but thinner 10-13% margins.
Why now
- FY27 defence budget ₹7.85L cr (+16%) with 75% capex domestic-only — structural mandate already converting into ₹2.54L cr HAL + ₹73.9k cr BEL live order books, not forecasts.
- Export engine now self-sustaining: ₹38,424 cr in FY26 (+63%), DPSUs growing 151% YoY, UAE/Gulf talks widening addressable market toward ₹60k cr+ by FY28
- Tejas Mk2 first flight imminent (Jun-Jul 2026) — programme milestone unlocks potential 108-jet IAF order and multi-billion export enquiries from Southeast Asia and Middle East.
Key risks
- Programme delays (GE F414 / F404 engine supply, CEMILAC certification bottlenecks) could defer HAL delivery schedules 12-18 months — consensus earnings at risk if Mk1A misses pace.
- Private integrators (Apollo Micro 80x+, DCX Systems, Cyient DLM) richly valued on thin 8-12% EBITDA with stretched debtors ; any earnings miss = 30-40% de-rating.
- MoD capital-outlay under-utilisation (historical 85-90% execution) risks headline order deferrals in an election budget year; export deals can face geopolitical hold-ups from buyer-nation approval cycles.
02The demand engine
Where the demand comes from — the structural drivers pulling the sector's order books.
Unlock the full Defence report
8 more sections — the graded universe, scenario analysis, institutional flows and the downloadable fund-grade PDF.
₹399/month · every sector report + Orion queries · cancel anytime · Already a member? Sign in
Frequently asked questions
How big is India's Defence opportunity?
India's defence budget has crossed ₹6.81L cr in FY26 (FY27 BE ₹7.85L cr, +16%) with ₹1.86L cr capital outlay… Key figures include ₹7.85L cr Defence budget FY27 BE (+16% YoY) and ₹1.86L cr Capital outlay FY26 — 75% domestic-only.
What is driving growth in India's Defence sector?
FY27 defence budget ₹7.85L cr (+16%) with 75% capex domestic-only — structural mandate already converting into ₹2.54L cr HAL + ₹73.9k cr BEL live order books, not forecasts.
What are the key risks in the India Defence sector?
Programme delays (GE F414 / F404 engine supply, CEMILAC certification bottlenecks) could defer HAL delivery schedules 12-18 months — consensus earnings at risk if Mk1A misses pace. Private integrators (Apollo Micro 80x+, DCX Systems, Cyient DLM) richly valued on thin 8-12% EBITDA with stretched debtors ; any earnings miss = 30-40% de-rating.
Where can I read VestAI's full analysis of the Defence sector?
VestAI's full Defence report covers every listed name with forensic screening, quality grades and scenario analysis — available to VestAI Pro and Max members.
India's ₹25.7L cr power + transmission super-cycle through 2030 is structural — underwritten by peak-demand…
India ESDM market ₹3.1L cr (~$37bn) is tracking toward ₹7-8L cr by 2030, underpinned by a ₹1.91L cr PLI outlay…
India's 500 GW renewable target by 2030 (currently ~230 GW installed) is the most capital-intensive build-out in…