India Power & T&D — sector deep-dive
India's ₹25.7L cr power + transmission super-cycle through 2030 is structural — underwritten by peak-demand…
01Executive summary
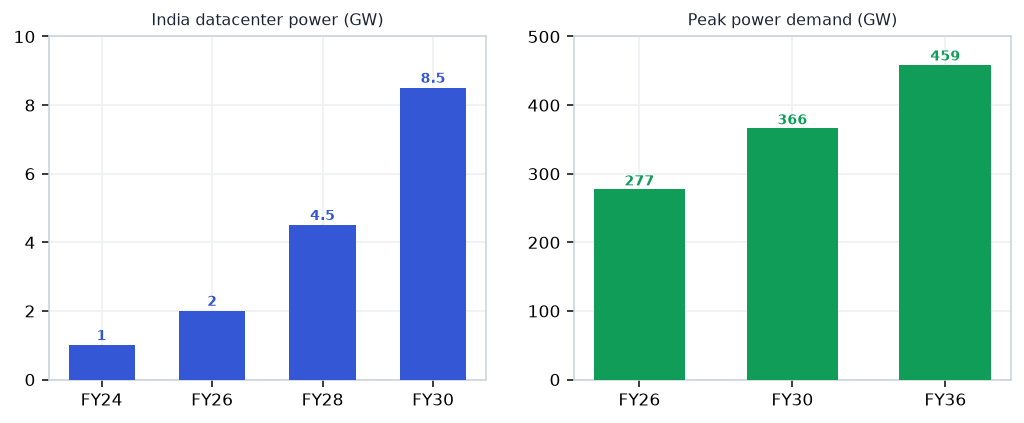
India's ₹25.7L cr power + transmission super-cycle through 2030 is structural — underwritten by peak-demand doubling (277→459 GW) and the AI-datacenter build-out (1→8-9 GW) — but profit concentrates in the tight oligopolies of EHV/HVDC transformers, GIS switchgear, and smart-metering where entry barriers and a 36-48 month global supply crunch provide durable pricing power. Quality cables (Polycab, KEI, RR Kabel) offer high revenue visibility and the sector's best cash conversion; EPC carries record order books but demands working-capital discipline.
Why now
- ₹25.7L cr government capex is budgeted & contractually underwritten — order books are live, not forecasts; Kalpataru alone holds ₹65k cr, Polycab's cables in 15+ states.
- DGTR CRGO anti-dumping initiation (22 Jun 2026) could compress transformer input costs sharply once domestic JSW-JFE capacity (FY28+) absorbs the duty shock.
- AI-datacenter build-out (1→8 GW by 2030) is a NEW demand layer on top of the grid super-cycle, pulling high-value EHV transformer and GIS orders now.
Key risks
- CRGO duty could raise input costs before domestic supply scales — transformer makers may face a 12–18 month margin squeeze if duty lands before JSW-JFE capacity is live.
- State DISCOM financial stress risks capex deferral and EPC receivables elongation — watch order-inflow pace vs ₹30k cr KPIL FY27 target.
- richly valued MNCs (ABB 95×, CG Power 122×, Siemens 167×) face sharp de-rating on any earnings miss; avoid anchoring to headline order-book growth.
02The demand engine
Where the demand comes from — the structural drivers pulling the sector's order books.
Unlock the full Power & T&D report
8 more sections — the graded universe, scenario analysis, institutional flows and the downloadable fund-grade PDF.
₹399/month · every sector report + Orion queries · cancel anytime · Already a member? Sign in
Frequently asked questions
How big is India's Power & T&D opportunity?
India's ₹25.7L cr power + transmission super-cycle through 2030 is structural — underwritten by peak-demand… Key figures include ₹25.7L cr Power + T&D capex to 2030 and 277 → 459 GW Peak demand FY26 → FY36.
What is driving growth in India's Power & T&D sector?
₹25.7L cr government capex is budgeted & contractually underwritten — order books are live, not forecasts; Kalpataru alone holds ₹65k cr, Polycab's cables in 15+ states.
What are the key risks in the India Power & T&D sector?
CRGO duty could raise input costs before domestic supply scales — transformer makers may face a 12–18 month margin squeeze if duty lands before JSW-JFE capacity is live. State DISCOM financial stress risks capex deferral and EPC receivables elongation — watch order-inflow pace vs ₹30k cr KPIL FY27 target.
Where can I read VestAI's full analysis of the Power & T&D sector?
VestAI's full Power & T&D report covers every listed name with forensic screening, quality grades and scenario analysis — available to VestAI Pro and Max members.
India's defence budget has crossed ₹6.81L cr in FY26 (FY27 BE ₹7.85L cr, +16%) with ₹1.86L cr capital outlay…
India ESDM market ₹3.1L cr (~$37bn) is tracking toward ₹7-8L cr by 2030, underpinned by a ₹1.91L cr PLI outlay…
India's 500 GW renewable target by 2030 (currently ~230 GW installed) is the most capital-intensive build-out in…