India Renewables & Solar — sector deep-dive
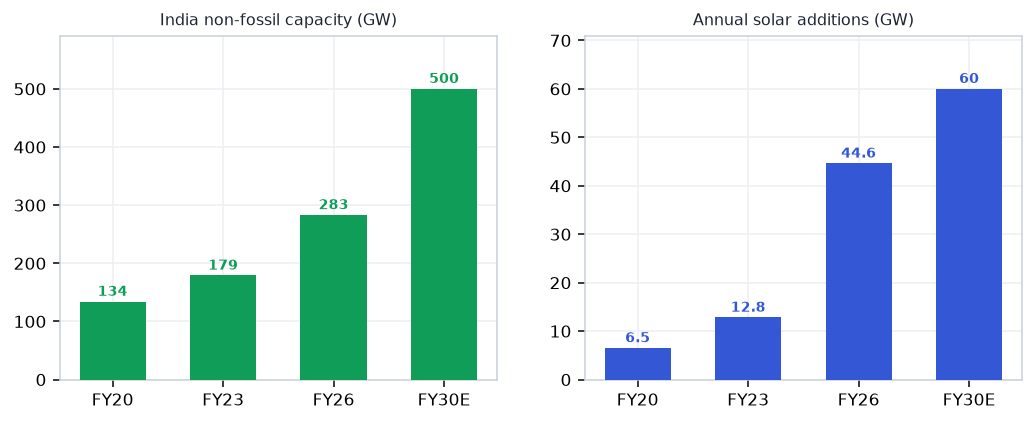
India's 500 GW renewable target by 2030 (currently ~230 GW installed) is the most capital-intensive build-out in…
01Executive summary
India's 500 GW renewable target by 2030 (currently ~230 GW installed) is the most capital-intensive build-out in the country's energy history — underwritten by ₹24,000 cr Solar PLI, ISTS waiver for renewables, and BCD protection (25% cells / 40% modules) that structurally advantages domestic integrated manufacturers. Record FY26 solar additions of 44.6 GW (31% above target) confirm execution is real, not aspirational. ALMM List-II enforcement from Jun 1, 2026 — mandating domestically certified cells — creates a durable moat for the handful of integrated players with own cell capacity. Profit concentrates in vertically integrated module + cell makers (Waaree, Premier) that combine captive manufacturing, PLI receipts, and 5-10 GW order books; pure-play downstream IPPs offer scale but thin FCF and leverage dilute equity returns.
Why now
- FY26 solar additions hit a record 44.6 GW — 31% above target — confirming the build-out is executing, not just announced; the 500 GW 2030 target requires sustained 50+ GW/yr from FY27
- ALMM List-II enforcement (Jun 1, 2026) instantly creates a structural domestic-cell shortage (31 GW certified vs 193 GW module capacity) — Waaree, Premier and Websol are the only safe sourcing destinations for government-linked projects.
- Waaree's FY27 EBITDA guidance (₹7,000-7,700 cr) implies ~80-95% YoY step-up — at current market cap this is not priced in; a clean Q1 FY27 print is the near-term re-rating trigger.
Key risks
- China dumping: Chinese modules land at ₹12-14/W vs domestic ₹28/W; any BCD relaxation or ALMM exemption — even partial — collapses domestic realisations and earnings estimates instantly.
- ALMM cell-shortage double-edged: while good for cell makers, a shortage that delays 10+ GW of government projects could trigger forced exemptions — watch MNRE press releases closely.
- Concentration + valuation risk: Waaree at ~35-40x FY27E and Premier at ~30x leave no room for error; FY27 earnings miss on export order delays or US-tariff headwinds = 25-35% downside.
02The demand engine
Where the demand comes from — the structural drivers pulling the sector's order books.
Unlock the full Renewables & Solar report
8 more sections — the graded universe, scenario analysis, institutional flows and the downloadable fund-grade PDF.
₹399/month · every sector report + Orion queries · cancel anytime · Already a member? Sign in
Frequently asked questions
How big is India's Renewables & Solar opportunity?
India's 500 GW renewable target by 2030 (currently ~230 GW installed) is the most capital-intensive build-out in… Key figures include 500 GW India RE target by 2030 (from ~230 GW today) and 44.6 GW Record solar additions FY26 — beat 34 GW target by 31%.
What is driving growth in India's Renewables & Solar sector?
FY26 solar additions hit a record 44.6 GW — 31% above target — confirming the build-out is executing, not just announced; the 500 GW 2030 target requires sustained 50+ GW/yr from FY27
What are the key risks in the India Renewables & Solar sector?
China dumping: Chinese modules land at ₹12-14/W vs domestic ₹28/W; any BCD relaxation or ALMM exemption — even partial — collapses domestic realisations and earnings estimates instantly. ALMM cell-shortage double-edged: while good for cell makers, a shortage that delays 10+ GW of government projects could trigger forced exemptions — watch MNRE press releases closely.
Where can I read VestAI's full analysis of the Renewables & Solar sector?
VestAI's full Renewables & Solar report covers every listed name with forensic screening, quality grades and scenario analysis — available to VestAI Pro and Max members.
India's ₹25.7L cr power + transmission super-cycle through 2030 is structural — underwritten by peak-demand…
India's defence budget has crossed ₹6.81L cr in FY26 (FY27 BE ₹7.85L cr, +16%) with ₹1.86L cr capital outlay…
India ESDM market ₹3.1L cr (~$37bn) is tracking toward ₹7-8L cr by 2030, underpinned by a ₹1.91L cr PLI outlay…