India Auto Ancillaries & Tyres — sector deep-dive
India's auto-ancillary universe tripled to ~₹5 lakh crore over the decade — an 11% revenue CAGR against 5-6%…
01Executive summary
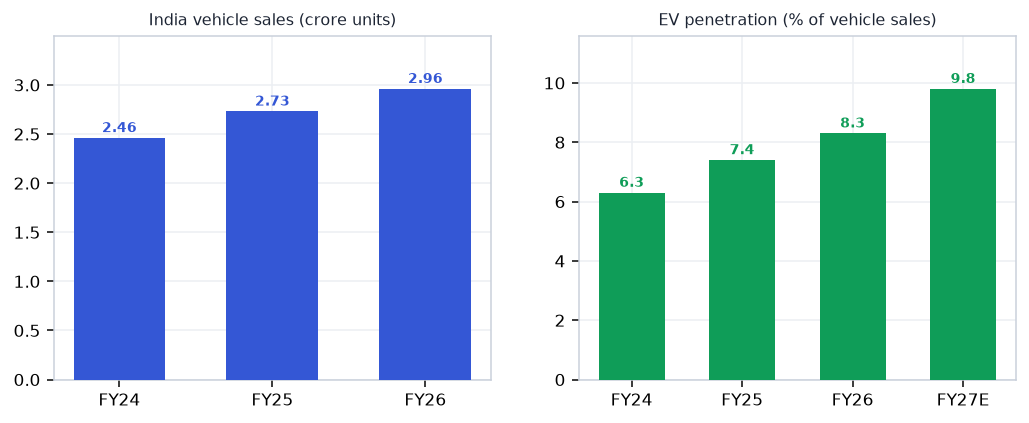
India's auto-ancillary universe tripled to ~₹5 lakh crore over the decade — an 11% revenue CAGR against 5-6% vehicle-volume growth — because the sector is paid more per vehicle every year: SUVs at 52% of the PV mix, mandated safety and emission electronics, LED premiumisation, and now an EV layer (8.3% penetration, +25% YoY in units) adding content categories that didn't exist in an ICE bill of materials. Exports compound the story: $12.1bn in H1 FY26 (+9.3%) with Indian parts now 20-25% cheaper than China-origin in the US, against ACMA-BCG's $100bn-by-FY30 map. FY26 was a record production year; FY27 opens with a commodity-trough quarter and volume growth decelerating to ICRA's 3-6% — making forensics, not momentum, the selection tool. The tyre complex converts best; the EV-content names carry the richest multiples; the whole chain's hardest dependency is Chinese NdFeB magnets.
Why now
- Content-per-vehicle inflation is structural, not cyclical — an 11% decade revenue CAGR on 5-6% volume growth, and the EV layer (BMS, high-voltage harness, traction motors) is additive to that math.
- The China+1 window is open and quantified: Indian components land 20-25% cheaper than China-origin in the US post-tariffs, and 80% of global CPOs surveyed by BCG are open to Indian sourcing.
- Q1 FY27 is a flagged commodity-trough quarter (CEAT guides RM −1-2% QoQ from Q2) — the margin-recovery entry point is dated, not hypothetical.
Key risks
- China's NdFeB magnet licensing (90% dependency) already disrupted production once in 2025 — a re-tightening gates every EV-content order book.
- FY27 volume growth decelerates to ICRA's 3-6% off a record base — operating leverage that flattered FY26 works in reverse on fixed-cost-heavy forgers and casters.
- Raw materials are 50-65% of cost with semi-annual OEM pass-through lags — the Q1 FY27 copper/rubber/crude spike lands on supplier P&Ls first.
02The demand engine
Where the demand comes from — the structural drivers pulling the sector's order books.
Unlock the full Auto Ancillaries & Tyres report
8 more sections — the graded universe, scenario analysis, institutional flows and the downloadable fund-grade PDF.
₹399/month · every sector report + Orion queries · cancel anytime · Already a member? Sign in
Frequently asked questions
How big is India's Auto Ancillaries & Tyres opportunity in 2026?
India's auto-ancillary universe tripled to ~₹5 lakh crore over the decade — an 11% revenue CAGR against 5-6%… The key numbers that frame the sector: ~₹5L cr (Listed ancillary revenue FY26 (+12.5%) — 3x in a decade); $12.1bn (H1 FY26 component exports (+9.3%) → $100bn FY30 map); 2.96 cr (FY26 vehicle sales — record year); 8.3% (EV penetration (+25% YoY units; PV EVs +84%)); 13.6% (Aggregate EBITDA margin — flat; RM ate the leverage). On the demand side, Vehicle production stands at 2.96 cr FY26 — record; Jan-26 saw PV+2W+3W all-time highs together. Together these define both the size of the Auto Ancillaries & Tyres profit pool and the pace at which it is compounding — the full report maps where along the value chain that value actually lands.
What is driving growth in India's Auto Ancillaries & Tyres sector?
Content-per-vehicle inflation is structural, not cyclical — an 11% decade revenue CAGR on 5-6% volume growth, and the EV layer (BMS, high-voltage harness, traction motors) is additive to that math. The China+1 window is open and quantified: Indian components land 20-25% cheaper than China-origin in the US post-tariffs, and 80% of global CPOs surveyed by BCG are open to Indian sourcing. Q1 FY27 is a flagged commodity-trough quarter (CEAT guides RM −1-2% QoQ from Q2) — the margin-recovery entry point is dated, not hypothetical. Each of these drivers is tracked in the report's catalyst section with dated windows, so readers can verify whether the thesis is playing out on schedule.
What are the key risks in the India Auto Ancillaries & Tyres sector?
China's NdFeB magnet licensing (90% dependency) already disrupted production once in 2025 — a re-tightening gates every EV-content order book. FY27 volume growth decelerates to ICRA's 3-6% off a record base — operating leverage that flattered FY26 works in reverse on fixed-cost-heavy forgers and casters. Raw materials are 50-65% of cost with semi-annual OEM pass-through lags — the Q1 FY27 copper/rubber/crude spike lands on supplier P&Ls first. The full report carries an eight-item risk register scored on likelihood and severity, plus a bear-case scenario that quantifies how these risks would transmit through each node of the value chain.
Which companies are covered in India's Auto Ancillaries & Tyres sector report?
The report covers 30 listed companies across the full value chain (Raw materials → Components → Systems → Tyres & batteries → Demand), so upstream suppliers, manufacturers and downstream distribution are all graded on the same yardstick. Names screening strongest on this objective test currently include CEAT, Samvardhana Motherson, Apollo Tyres, Exide Industries, Minda Corporation. Every company named in the report links to its live VestAI stock page, and the universe table lets readers sort the full list on valuation, returns and balance-sheet quality.
How does VestAI grade Auto Ancillaries & Tyres companies?
Every name in the universe is graded on cash conversion — cumulative 3-year operating cash flow measured against reported profit. This is a data classification, not an opinion: the grade asks whether reported profits actually arrive as cash, which is where accounting-quality problems show up first. The same forensic yardstick is applied across all 30 VestAI sector reports, so a grade in Auto Ancillaries & Tyres is directly comparable to a grade in any other sector — and grades refresh with each quarterly data update.
Where can I read VestAI's full Auto Ancillaries & Tyres sector analysis?
The free version of this page includes the executive summary, key sector numbers, demand drivers, key risks and this FAQ — enough to understand how the Auto Ancillaries & Tyres value chain earns its money. VestAI Pro and Max members unlock the full report: the complete value-chain map with node economics, dated recent developments, the catalyst tracker, competitive structure, the scenario matrix with per-node impacts, the graded 30-company universe with an interactive comparison table, and a downloadable 15-page PDF edition. Reports are rebuilt each quarter on fresh filings, and all content is educational research rather than investment advice.
India's ₹25.7L cr power + transmission super-cycle through 2030 is structural — underwritten by peak-demand…
India's defence budget has crossed ₹6.81L cr in FY26 (FY27 BE ₹7.85L cr, +16%) with ₹1.86L cr capital outlay…
India ESDM market ₹3.1L cr (~$37bn) is tracking toward ₹7-8L cr by 2030, underpinned by a ₹1.91L cr PLI outlay…