India Logistics, Ports & Shipping — sector deep-dive
India's logistics build-out is a policy-engineered compression of the cost of distance: from ~13–14% of GDP a…
01Executive summary
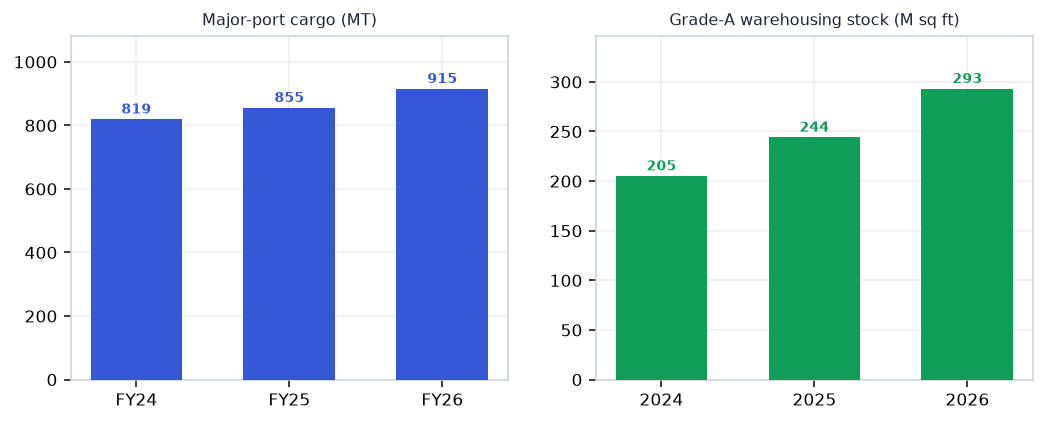
India's logistics build-out is a policy-engineered compression of the cost of distance: from ~13–14% of GDP a decade ago to ~10.7% now, chasing the National Logistics Policy's 8% by 2030 on ₹12.2 lakh crore of FY27 public capex. FY26 set records at every node — major ports at 915 MT (+7%), JNPA at 8.17M TEU (+12%), the DFC 85% utilised, Grade-A warehousing up 20% — and the Vizhinjam-MSC deal ($1.4bn for 49%) marks the transhipment repatriation bet going institutional. The economics split cleanly: infrastructure owners (ports, terminals, gas logistics) convert volume records into 50%+ EBITDA margins, while the value-add layer — express, 3PL, cold chain — is still converting scale into margin. Shipping's record FY26 is cycle, not structure. The binding constraints are human and physical: 55 drivers per 100 trucks, and only one Indian port that can berth the world's biggest ships.
Why now
- The DFC's western last-mile to JNPT is in final commissioning — the port-to-rail loop closes in FY27, and containerised DFC freight is already the fastest-growing rail segment (10.06 MT, 9,621 rakes FY26).
- MSC's Terminal Investment Ltd paid $1.4bn for 49% of Vizhinjam (Jun 2026) — the world's #1 container line underwriting India's recapture of the 6–8M TEU/year now leaking to Colombo and Singapore.
- FY26 records across the chain (915 MT ports, 8.17M JNPA TEU, +20% Grade-A warehousing) prove the volume cycle; ₹12.2L cr FY27 public capex extends the runway.
Key risks
- The cabotage waiver expires October 2026 — a revocation would disrupt transhipment volumes at Vizhinjam and JNPA just as the hub thesis scales.
- Shipping earnings are cycle-peak: Red Sea normalisation compresses tanker/bulk rates 30–50% off highs — SCI and GE Shipping's record FY26 is the top of the range, not the base.
- The driver shortage (55 per 100 trucks; ~2.2M trucks idle) puts a structural floor under road-freight costs and caps the express/3PL margin path.
02The demand engine
Where the demand comes from — the structural drivers pulling the sector's order books.
Unlock the full Logistics, Ports & Shipping report
8 more sections — the graded universe, scenario analysis, institutional flows and the downloadable fund-grade PDF.
₹399/month · every sector report + Orion queries · cancel anytime · Already a member? Sign in
Frequently asked questions
How big is India's Logistics, Ports & Shipping opportunity in 2026?
India's logistics build-out is a policy-engineered compression of the cost of distance: from ~13–14% of GDP a… The key numbers that frame the sector: ~10.7% → 8% (Logistics cost / GDP — FY26 vs NLP 2030 target); 915 MT (Major-port cargo FY26 (+7.1%, record)); 85% (DFC utilisation — 4% of network, >13% of rail freight); 293M sq ft (Grade-A warehousing (+20% YoY)); $1.4bn (MSC/TiL for 49% of Vizhinjam — the transhipment bet). On the demand side, EXIM trade FY26 stands at $860bn — goods+services exports +4.2%; JNPA TEU +12%. Together these define both the size of the Logistics, Ports & Shipping profit pool and the pace at which it is compounding — the full report maps where along the value chain that value actually lands.
What is driving growth in India's Logistics, Ports & Shipping sector?
The DFC's western last-mile to JNPT is in final commissioning — the port-to-rail loop closes in FY27, and containerised DFC freight is already the fastest-growing rail segment (10.06 MT, 9,621 rakes FY26). MSC's Terminal Investment Ltd paid $1.4bn for 49% of Vizhinjam (Jun 2026) — the world's #1 container line underwriting India's recapture of the 6–8M TEU/year now leaking to Colombo and Singapore. FY26 records across the chain (915 MT ports, 8.17M JNPA TEU, +20% Grade-A warehousing) prove the volume cycle; ₹12.2L cr FY27 public capex extends the runway. Each of these drivers is tracked in the report's catalyst section with dated windows, so readers can verify whether the thesis is playing out on schedule.
What are the key risks in the India Logistics, Ports & Shipping sector?
The cabotage waiver expires October 2026 — a revocation would disrupt transhipment volumes at Vizhinjam and JNPA just as the hub thesis scales. Shipping earnings are cycle-peak: Red Sea normalisation compresses tanker/bulk rates 30–50% off highs — SCI and GE Shipping's record FY26 is the top of the range, not the base. The driver shortage (55 per 100 trucks; ~2.2M trucks idle) puts a structural floor under road-freight costs and caps the express/3PL margin path. The full report carries an eight-item risk register scored on likelihood and severity, plus a bear-case scenario that quantifies how these risks would transmit through each node of the value chain.
Which companies are covered in India's Logistics, Ports & Shipping sector report?
The report covers 17 listed companies across the full value chain (Infrastructure → Line-haul → Express & 3PL → Digital → Demand), so upstream suppliers, manufacturers and downstream distribution are all graded on the same yardstick. Names screening strongest on this objective test currently include Mahindra Logistics, Snowman Logistics, VRL Logistics, Blue Dart Express, Allcargo Logistics. Every company named in the report links to its live VestAI stock page, and the universe table lets readers sort the full list on valuation, returns and balance-sheet quality.
How does VestAI grade Logistics, Ports & Shipping companies?
Every name in the universe is graded on cash conversion — cumulative 3-year operating cash flow measured against reported profit. This is a data classification, not an opinion: the grade asks whether reported profits actually arrive as cash, which is where accounting-quality problems show up first. The same forensic yardstick is applied across all 30 VestAI sector reports, so a grade in Logistics, Ports & Shipping is directly comparable to a grade in any other sector — and grades refresh with each quarterly data update.
Where can I read VestAI's full Logistics, Ports & Shipping sector analysis?
The free version of this page includes the executive summary, key sector numbers, demand drivers, key risks and this FAQ — enough to understand how the Logistics, Ports & Shipping value chain earns its money. VestAI Pro and Max members unlock the full report: the complete value-chain map with node economics, dated recent developments, the catalyst tracker, competitive structure, the scenario matrix with per-node impacts, the graded 17-company universe with an interactive comparison table, and a downloadable 15-page PDF edition. Reports are rebuilt each quarter on fresh filings, and all content is educational research rather than investment advice.
India's ₹25.7L cr power + transmission super-cycle through 2030 is structural — underwritten by peak-demand…
India's defence budget has crossed ₹6.81L cr in FY26 (FY27 BE ₹7.85L cr, +16%) with ₹1.86L cr capital outlay…
India ESDM market ₹3.1L cr (~$37bn) is tracking toward ₹7-8L cr by 2030, underpinned by a ₹1.91L cr PLI outlay…