India Aviation & Travel — sector deep-dive
India's aviation thesis is a supply problem wearing a demand costume.
01Executive summary
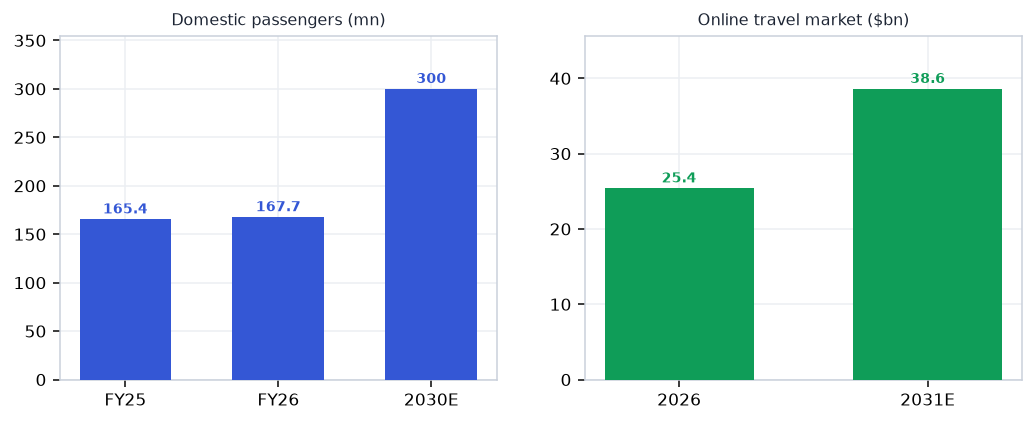
India's aviation thesis is a supply problem wearing a demand costume. Penetration of 12-13 trips per 100 people and a 1,500+ aircraft order book (IndiGo 985, Air India 524) define the decade; but FY26 delivered only 1.4% passenger growth to 167.7mn because the aircraft aren't there — 64 IndiGo jets grounded on P&W's engine defect (38% of the global GTF-neo fleet is parked), SpiceJet down to 32 operational aircraft, and ICRA counting ₹17-18k cr of industry losses. The structure, though, keeps improving for the survivors: IndiGo's 63.6% share is a duopoly-in-progress with a ₹7,500 cr ex-forex profit hiding under a forex-driven headline loss; GMR printed its first positive PAT in a decade on record ₹15,201 cr revenue; two greenfield airports (NMIA, Jewar) opened within six months, with NMIA going international July 15. Travel-tech compounds independently of the aircraft queue — TBO +86%, RateGain +69%, Ixigo profitable at scale — while the casualties (EaseMyTrip's 98.9% promoter pledge, DreamFolks' −45% revenue) show what disruption and governance failure look like.
Why now
- The capacity map redraws this quarter: NMIA international ops start July 15, Jewar goes international in September — Mumbai and NCR, India's two most constrained markets, get greenfield relief at once.
- The P&W curve has inflected: groundings down from ~75 to 64, GTF Advantage certified (Apr-26) — every quarter of decline converts directly to ASKs, yields and working capital for the market leader.
- FY26's ₹17-18k cr loss year set the entry math: the franchise names printed their stress-case numbers (IndiGo ex-forex profitable, GMR EBITDA +47%) while the weak tail is exiting the market.
Key risks
- Single-supplier engine dependency: another P&W defect or inspection mandate extends the grounding cycle for years — 985 of IndiGo's order book rides on the same programme.
- Fuel and forex together erased IndiGo's entire FY25 profit in FY26 — a 5% INR slide adds ~₹1,500-2,000 cr of cost, and ATF above ₹110/L keeps the sector's cost floor elevated.
- AERA regulatory risk cuts both ways: a delayed or adverse Delhi tariff order stalls GMR's re-rating; an aggressive one raises airline costs into a fare-sensitive market.
02The demand engine
Where the demand comes from — the structural drivers pulling the sector's order books.
Unlock the full Aviation & Travel report
8 more sections — the graded universe, scenario analysis, institutional flows and the downloadable fund-grade PDF.
₹399/month · every sector report + Orion queries · cancel anytime · Already a member? Sign in
Frequently asked questions
How big is India's Aviation & Travel opportunity in 2026?
India's aviation thesis is a supply problem wearing a demand costume. The key numbers that frame the sector: 167.7mn (+1.4%) (FY26 domestic pax — capacity-capped, not demand-capped); 1,500+ (Aircraft on order across IndiGo + Air India); 64 grounded (IndiGo P&W jets ≈ ₹1,600-1,900 cr EBITDA drag); 63.6% (IndiGo domestic share — and widening); ₹6,150 cr (GMR FY26 EBITDA (+47%); first PAT in a decade). On the demand side, Penetration stands at 12–13 / 100 — air trips per capita — far below global average; the structural runway. Together these define both the size of the Aviation & Travel profit pool and the pace at which it is compounding — the full report maps where along the value chain that value actually lands.
What is driving growth in India's Aviation & Travel sector?
The capacity map redraws this quarter: NMIA international ops start July 15, Jewar goes international in September — Mumbai and NCR, India's two most constrained markets, get greenfield relief at once. The P&W curve has inflected: groundings down from ~75 to 64, GTF Advantage certified (Apr-26) — every quarter of decline converts directly to ASKs, yields and working capital for the market leader. FY26's ₹17-18k cr loss year set the entry math: the franchise names printed their stress-case numbers (IndiGo ex-forex profitable, GMR EBITDA +47%) while the weak tail is exiting the market. Each of these drivers is tracked in the report's catalyst section with dated windows, so readers can verify whether the thesis is playing out on schedule.
What are the key risks in the India Aviation & Travel sector?
Single-supplier engine dependency: another P&W defect or inspection mandate extends the grounding cycle for years — 985 of IndiGo's order book rides on the same programme. Fuel and forex together erased IndiGo's entire FY25 profit in FY26 — a 5% INR slide adds ~₹1,500-2,000 cr of cost, and ATF above ₹110/L keeps the sector's cost floor elevated. AERA regulatory risk cuts both ways: a delayed or adverse Delhi tariff order stalls GMR's re-rating; an aggressive one raises airline costs into a fare-sensitive market. The full report carries an eight-item risk register scored on likelihood and severity, plus a bear-case scenario that quantifies how these risks would transmit through each node of the value chain.
Which companies are covered in India's Aviation & Travel sector report?
The report covers 13 listed companies across the full value chain (Airports & infra → Airlines → Aero-mfg & MRO → Travel distribution → Demand), so upstream suppliers, manufacturers and downstream distribution are all graded on the same yardstick. Names screening strongest on this objective test currently include InterGlobe Aviation, Thomas Cook India, Dynamatic Technologies, ideaForge, Ixigo (Le Travenues). Every company named in the report links to its live VestAI stock page, and the universe table lets readers sort the full list on valuation, returns and balance-sheet quality.
How does VestAI grade Aviation & Travel companies?
Every name in the universe is graded on cash conversion — cumulative 3-year operating cash flow measured against reported profit. This is a data classification, not an opinion: the grade asks whether reported profits actually arrive as cash, which is where accounting-quality problems show up first. The same forensic yardstick is applied across all 30 VestAI sector reports, so a grade in Aviation & Travel is directly comparable to a grade in any other sector — and grades refresh with each quarterly data update.
Where can I read VestAI's full Aviation & Travel sector analysis?
The free version of this page includes the executive summary, key sector numbers, demand drivers, key risks and this FAQ — enough to understand how the Aviation & Travel value chain earns its money. VestAI Pro and Max members unlock the full report: the complete value-chain map with node economics, dated recent developments, the catalyst tracker, competitive structure, the scenario matrix with per-node impacts, the graded 13-company universe with an interactive comparison table, and a downloadable 15-page PDF edition. Reports are rebuilt each quarter on fresh filings, and all content is educational research rather than investment advice.
India's ₹25.7L cr power + transmission super-cycle through 2030 is structural — underwritten by peak-demand…
India's defence budget has crossed ₹6.81L cr in FY26 (FY27 BE ₹7.85L cr, +16%) with ₹1.86L cr capital outlay…
India ESDM market ₹3.1L cr (~$37bn) is tracking toward ₹7-8L cr by 2030, underpinned by a ₹1.91L cr PLI outlay…