India Textiles, Apparel & Footwear — sector deep-dive
Indian textiles enters FY27 with three independent tailwinds converging: the UK FTA goes duty-free on July 15,…
01Executive summary
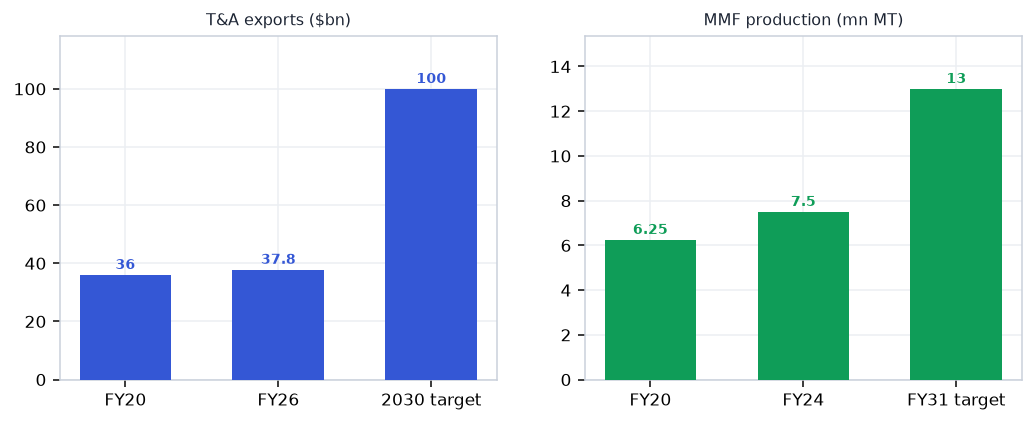
Indian textiles enters FY27 with three independent tailwinds converging: the UK FTA goes duty-free on July 15, 2026 (a $1.35bn/yr apparel opportunity, UK share targeted to double to 12%); the US bilateral framework fixes India at 18% against Bangladesh and Vietnam at 20% — the best rate among major garment exporters; and Bangladesh's disruption keeps diverting orders. FY26 was the stress test — a 50% US tariff for six months split the sector cleanly: domestic-facing names grew (Siyaram +16%, Raymond Lifestyle +11%) while US-facing exporters bled (Welspun −11.5%, Himatsingka margin 18%→8%). The structural drag is home-made: cotton MSP prices Indian fibre 5–7 cents/lb above the world, taxing every node from spinning to innerwear — it collapsed Lux's margin ~400bps while Bangladesh buys at Cotlook prices. The near-term binary is dated: US Section 122 authority expires ~July 24, 2026 with the full BTA still unsigned.
Why now
- The UK FTA is not a forecast — it is in force July 15, 2026, with zero duty on categories that carried 10–16%; first-mover order books get written in Q2-Q3 FY27
- The US rate architecture flipped from worst (50% for six months) to best (18% vs peers' 20%) — FY26 trough earnings across home textiles and garmenting are the entry math, not the run-rate.
- Footwear QCO enforcement is squeezing Chinese imports while global brands scale India manufacturing — organised share heads from ~35% to 40%+ of a $38bn market.
Key risks
- US Section 122 expires ~July 24, 2026 with the BTA unsigned — a re-escalation replays the FY26 shock, and it has already materialised once (Gokaldas PAT −37% absorbed it).
- Cotton MSP is politically inviolable (90.97 lakh bales bought at ₹36,355 cr this season) — a further FY27 hike compresses spinning and innerwear another 200bps.
- Bangladesh stabilising would reverse the order diversion: it remains 2.5x India's garment volume with structurally cheaper fibre.
02The demand engine
Where the demand comes from — the structural drivers pulling the sector's order books.
Unlock the full Textiles, Apparel & Footwear report
8 more sections — the graded universe, scenario analysis, institutional flows and the downloadable fund-grade PDF.
₹399/month · every sector report + Orion queries · cancel anytime · Already a member? Sign in
Frequently asked questions
How big is India's Textiles, Apparel & Footwear opportunity in 2026?
Indian textiles enters FY27 with three independent tailwinds converging: the UK FTA goes duty-free on July 15,… The key numbers that frame the sector: 0% from Jul 15 (UK CETA duty on apparel/footwear (was 10–16%)); 18% vs 20% (US tariff: India vs Bangladesh/Vietnam); 5–7 c/lb (Cotton MSP premium over Cotlook A — the chain's tax); ~$37.8bn (FY26 T&A exports — flat through the tariff shock); +$1.35bn/yr (UK FTA apparel opportunity; share 6% → 12%). On the demand side, RMG exports FY26 stands at $14.53bn — 45% of T&A exports (Apr–Feb); +2.9% in ₹ through the tariff year. Together these define both the size of the Textiles, Apparel & Footwear profit pool and the pace at which it is compounding — the full report maps where along the value chain that value actually lands.
What is driving growth in India's Textiles, Apparel & Footwear sector?
The UK FTA is not a forecast — it is in force July 15, 2026, with zero duty on categories that carried 10–16%; first-mover order books get written in Q2-Q3 FY27. The US rate architecture flipped from worst (50% for six months) to best (18% vs peers' 20%) — FY26 trough earnings across home textiles and garmenting are the entry math, not the run-rate. Footwear QCO enforcement is squeezing Chinese imports while global brands scale India manufacturing — organised share heads from ~35% to 40%+ of a $38bn market. Each of these drivers is tracked in the report's catalyst section with dated windows, so readers can verify whether the thesis is playing out on schedule.
What are the key risks in the India Textiles, Apparel & Footwear sector?
US Section 122 expires ~July 24, 2026 with the BTA unsigned — a re-escalation replays the FY26 shock, and it has already materialised once (Gokaldas PAT −37% absorbed it). Cotton MSP is politically inviolable (90.97 lakh bales bought at ₹36,355 cr this season) — a further FY27 hike compresses spinning and innerwear another 200bps. Bangladesh stabilising would reverse the order diversion: it remains 2.5x India's garment volume with structurally cheaper fibre. The full report carries an eight-item risk register scored on likelihood and severity, plus a bear-case scenario that quantifies how these risks would transmit through each node of the value chain.
Which companies are covered in India's Textiles, Apparel & Footwear sector report?
The report covers 23 listed companies across the full value chain (Fibre & yarn → Fabric → Garmenting → Brands → Retail & footwear), so upstream suppliers, manufacturers and downstream distribution are all graded on the same yardstick. Names screening strongest on this objective test currently include Raymond Lifestyle, Sanathan Textiles, Himatsingka Seide, Bata India, Kitex Garments. Every company named in the report links to its live VestAI stock page, and the universe table lets readers sort the full list on valuation, returns and balance-sheet quality.
How does VestAI grade Textiles, Apparel & Footwear companies?
Every name in the universe is graded on cash conversion — cumulative 3-year operating cash flow measured against reported profit. This is a data classification, not an opinion: the grade asks whether reported profits actually arrive as cash, which is where accounting-quality problems show up first. The same forensic yardstick is applied across all 30 VestAI sector reports, so a grade in Textiles, Apparel & Footwear is directly comparable to a grade in any other sector — and grades refresh with each quarterly data update.
Where can I read VestAI's full Textiles, Apparel & Footwear sector analysis?
The free version of this page includes the executive summary, key sector numbers, demand drivers, key risks and this FAQ — enough to understand how the Textiles, Apparel & Footwear value chain earns its money. VestAI Pro and Max members unlock the full report: the complete value-chain map with node economics, dated recent developments, the catalyst tracker, competitive structure, the scenario matrix with per-node impacts, the graded 23-company universe with an interactive comparison table, and a downloadable 15-page PDF edition. Reports are rebuilt each quarter on fresh filings, and all content is educational research rather than investment advice.
India's ₹25.7L cr power + transmission super-cycle through 2030 is structural — underwritten by peak-demand…
India's defence budget has crossed ₹6.81L cr in FY26 (FY27 BE ₹7.85L cr, +16%) with ₹1.86L cr capital outlay…
India ESDM market ₹3.1L cr (~$37bn) is tracking toward ₹7-8L cr by 2030, underpinned by a ₹1.91L cr PLI outlay…