India Telecom — sector deep-dive
India telecom has consolidated to a structural 3-player market (Airtel, Jio, Vi) with ARPU repair firmly underway…
01Executive summary
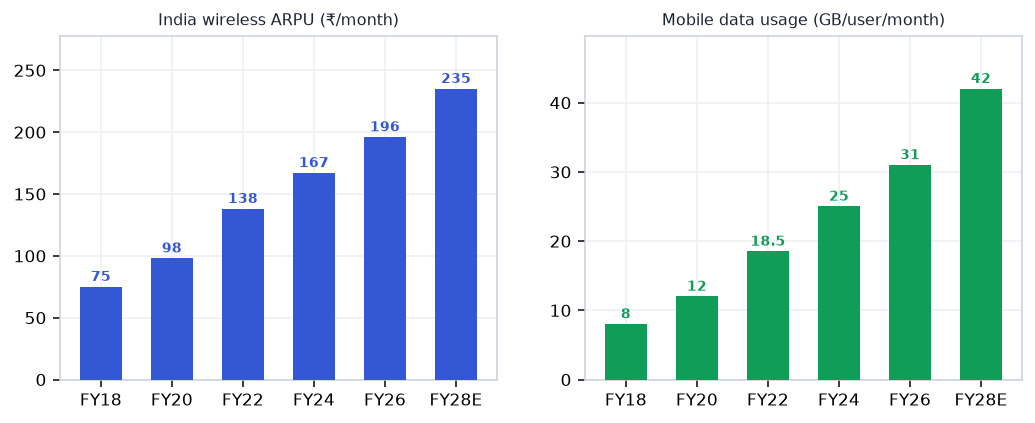
India telecom has consolidated to a structural 3-player market (Airtel, Jio, Vi) with ARPU repair firmly underway — Airtel hit ₹257 in Q4 FY26 and a further ~15% industry tariff hike is expected by July 2026, targeting ₹250+ sector-wide. 5G subscriber momentum (Jio alone at 234M+ by Sep 2025) unlocks digital services and data-revenue upsell. Tower infrastructure (Indus Towers, 442K sites) benefits from compulsory 5G co-location additions without capex dilution. Tanla Platforms is the under-owned CPaaS disruptor — ₹4,418 cr revenue, ₹1,000 cr net cash, and Wisely AI winning telco-grade enterprise contracts globally. FIIs have rotated out of Airtel (priced at 55x with repair half-complete); the smarter play is Airtel quality + Indus yield + Tanla value.
Why now
- 15% tariff hike imminent (Jul 2026) — Airtel ARPU still ₹40-50 below ₹300 target; every hike is mechanically passed to EBITDA at 57-58% margin with minimal incremental cost.
- Structural 3-player consolidation is complete — Vi's AGR freeze locks in Airtel/Jio duopoly economics; subscriber migration tail is 3-5 years of structural ARPU mix improvement.
- Indus Towers and Tanla are pricing in sector pessimism — Indus at FCF yield ~8% and Tanla at sub-10x EV/EBITDA with ₹1,000 cr cash; both offer asymmetric R:R relative to Airtel at 55x.
Key risks
- Tariff hike delayed by regulatory/political pressure (Vi election sensitivity) — caps Airtel ARPU at ₹265-270, compresses FY27 earnings upgrade cycle and may trigger de-rating at 55x PE.
- Indus Towers Vi-receivable concentration (~30% of revenue) — if Vi defaults or shrinks rapidly, Indus tenancy drops and FCF takes a one-time hit (not in base-case pricing).
- Tanla Wisely AI deal pipeline stalls — if no new telco ATP contracts emerge in 2 quarters, the platform segment (~9% of rev at 98% GM) is priced in; multiple compression resumes.
02The demand engine
Where the demand comes from — the structural drivers pulling the sector's order books.
Unlock the full Telecom report
8 more sections — the graded universe, scenario analysis, institutional flows and the downloadable fund-grade PDF.
₹399/month · every sector report + Orion queries · cancel anytime · Already a member? Sign in
Frequently asked questions
How big is India's Telecom opportunity?
India telecom has consolidated to a structural 3-player market (Airtel, Jio, Vi) with ARPU repair firmly underway… Key figures include 1.1B+ India wireless subscribers and ₹257 Airtel Q4 FY26 India ARPU (vs ₹211 a year ago).
What is driving growth in India's Telecom sector?
15% tariff hike imminent (Jul 2026) — Airtel ARPU still ₹40-50 below ₹300 target; every hike is mechanically passed to EBITDA at 57-58% margin with minimal incremental cost.
What are the key risks in the India Telecom sector?
Tariff hike delayed by regulatory/political pressure (Vi election sensitivity) — caps Airtel ARPU at ₹265-270, compresses FY27 earnings upgrade cycle and may trigger de-rating at 55x PE. Indus Towers Vi-receivable concentration (~30% of revenue) — if Vi defaults or shrinks rapidly, Indus tenancy drops and FCF takes a one-time hit (not in base-case pricing).
Where can I read VestAI's full analysis of the Telecom sector?
VestAI's full Telecom report covers every listed name with forensic screening, quality grades and scenario analysis — available to VestAI Pro and Max members.
India's ₹25.7L cr power + transmission super-cycle through 2030 is structural — underwritten by peak-demand…
India's defence budget has crossed ₹6.81L cr in FY26 (FY27 BE ₹7.85L cr, +16%) with ₹1.86L cr capital outlay…
India ESDM market ₹3.1L cr (~$37bn) is tracking toward ₹7-8L cr by 2030, underpinned by a ₹1.91L cr PLI outlay…