India Real Estate — sector deep-dive
India's premium housing upcycle is structurally intact — ₹1 cr+ units growing 25-30% YoY while affordable housing…
01Executive summary
India's premium housing upcycle is structurally intact — ₹1 cr+ units growing 25-30% YoY while affordable housing stays muted, signalling a quality-led demand shift. Office absorption hit a record ~70M sqft in FY26, retail REITs are printing record footfalls, and DLF's landmark ₹14,778 cr pre-sales (+32%) validate developer pricing power. The RBI rate-cut cycle (50 bps cumulative so far) lowers EMI burden and compresses cap rates on rental assets, supporting REIT re-rating. Land-bank monetisation (DLF Privana, Oberoi Elysian) is unlocking hidden NAV. FII shareholding is declining but domestic HNI + REIT unit-holder flows remain sticky. The sector offers three distinct plays: capital-appreciation via premium residential (DLF, Oberoi), annuity income via retail/office REITs (Nexus Select, Embassy), and high-conviction growth via mall operators (Phoenix Mills). Key risk is rate reversal or demand slowdown in the ₹2-5 cr band.
Why now
- RBI rate-cut cycle has 1-2 more cuts left in FY27 — cap-rate compression for REITs is still mid-cycle, not priced in.
- DLF Privana Phase 3 and Oberoi Elysian deliveries are imminent revenue recognition events in FY27 — earnings upgrade cycle begins.
- Office absorption at all-time high with GCC demand structural, not cyclical — validates 5-year commercial capex pipelines of Embassy + Nexus.
- Premium housing scarcity (₹2-5 cr band in Mumbai/Delhi) = pricing power; developers hiking prices 8-12% YoY without volume loss.
- Post-SEBI REIT leverage relaxation: growth capex for mall expansion re-rated as value-accretive vs prior concern over dilution.
Key risks
- US recession / GCC pullback: 40-50% of Grade-A office demand is GCC-linked — a US slowdown would crater absorption to 50-55M sqft.
- RBI rate pause or reversal: If CPI re-accelerates (food/oil shock), 10-yr G-sec could spike to 7.2%, compressing REIT valuations 10-15%
- Premium demand ceiling: The ₹2-5 cr band is crowded with new supply in Noida/Hyderabad — price discovery risk if HNI discretionary slows.
- Developer execution risk: Godrej Properties and Sobha have shown launch-to-collection gaps; over-leverage + slow collections = balance sheet stress.
- FII sustained outflows: Real estate is a significant FII holding — if EM risk-off deepens, sector could see 15-20% de-rating independent of fundamentals.
- Regulatory risk: RERA enforcement tightening, stamp duty hikes in Maharashtra or Haryana, or FSI cap changes could shift launch economics.
02The demand engine
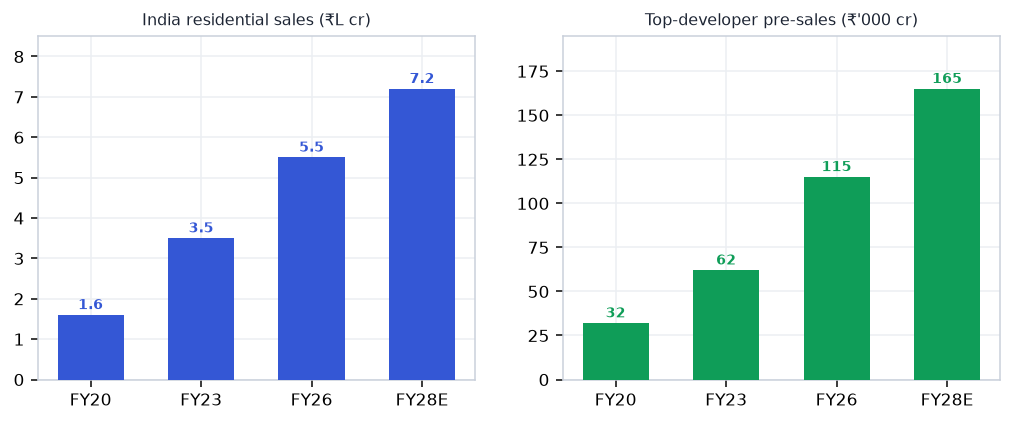
Where the demand comes from — the structural drivers pulling the sector's order books.
Unlock the full Real Estate report
8 more sections — the graded universe, scenario analysis, institutional flows and the downloadable fund-grade PDF.
₹399/month · every sector report + Orion queries · cancel anytime · Already a member? Sign in
Frequently asked questions
How big is India's Real Estate opportunity?
India's premium housing upcycle is structurally intact — ₹1 cr+ units growing 25-30% YoY while affordable housing… Key figures include ₹14,778 cr DLF pre-sales FY26 (+32% YoY) and 70M sqft Office absorption FY26 — all-time record.
What is driving growth in India's Real Estate sector?
RBI rate-cut cycle has 1-2 more cuts left in FY27 — cap-rate compression for REITs is still mid-cycle, not priced in.
What are the key risks in the India Real Estate sector?
US recession / GCC pullback: 40-50% of Grade-A office demand is GCC-linked — a US slowdown would crater absorption to 50-55M sqft. RBI rate pause or reversal: If CPI re-accelerates (food/oil shock), 10-yr G-sec could spike to 7.2%, compressing REIT valuations 10-15%
Where can I read VestAI's full analysis of the Real Estate sector?
VestAI's full Real Estate report covers every listed name with forensic screening, quality grades and scenario analysis — available to VestAI Pro and Max members.
India's ₹25.7L cr power + transmission super-cycle through 2030 is structural — underwritten by peak-demand…
India's defence budget has crossed ₹6.81L cr in FY26 (FY27 BE ₹7.85L cr, +16%) with ₹1.86L cr capital outlay…
India ESDM market ₹3.1L cr (~$37bn) is tracking toward ₹7-8L cr by 2030, underpinned by a ₹1.91L cr PLI outlay…