πŸ’Š Industry Report Β· Pharma / CDMO

India Pharma / CDMO β€” sector deep-dive

India is the world's pharmacy β€” $31bn FY26 exports, 20% of global generic volumes β€” and the generics cash cow is…

VVestAI ResearchUpdated 2026-07-0614 min read28 companies
TL;DR β€” India is the world's pharmacy β€” $31bn FY26 exports, 20% of global generic volumes β€” and the generics cash cow is… Key figures: $31bn India pharma exports FY26 (+2.1% YoY, 20% global generic share) and 3 OAIs USFDA Official Action Indicated outcomes FY26 (down from 7 in FY25). This report screens every listed Pharma / CDMO name on cash conversion, balance-sheet quality and valuation.
$31bn
India pharma exports FY26 (+2.1% YoY, 20% global generic share)
3 OAIs
USFDA Official Action Indicated outcomes FY26 (down from 7 in FY25)
13-15% CAGR
India CDMO market growth β€” $8.4bn (2024) β†’ $15.4bn (2029)
$60bn+
Global biosimilar market opportunity by 2030
30.3%
Sun Pharma FY26 EBITDA margin (specialty pivot delivering)

01Executive summary

India is the world's pharmacy β€” $31bn FY26 exports, 20% of global generic volumes β€” and the generics cash cow is now funding a structural pivot into higher-margin specialty and CDMO. The US generics pricing reset is largely done; specialty/branded is rebuilding Sun Pharma's 30%+ EBITDA margins. China+1 is funnelling $8-15bn CDMO outsourcing opportunity to India's API-CDMO champions (Neuland, Syngene, Blue Jet, Laurus). Biosimilars β€” a $60bn+ global opportunity by 2030 β€” and GLP-1 peptides are the next earnings inflection. USFDA compliance overhang is easing: OAI count fell 3Γ— in FY26.

Why now

  • US generics pricing reset is mostly done β€” marginal improvement + specialty mix-up positions Sun/Cipla for 200-300 bps EBITDA margin expansion FY27-28 from a clean base.
  • China+1 CDMO outsourcing structurally accelerating ($8.4bnβ†’$15.4bn by 2029 at 13-15% CAGR); Neuland and Syngene (BMS to 2035) are signing multi-year anchor deals NOW.
  • GLP-1/peptide wave is the next leg β€” semaglutide biosimilar approved India Mar 2026; 7-10 brands by FY27; India CDMO is the natural manufacture-for-world hub on peptide capacity.

Key risks

  • US Section 232 pharma tariff (10-25% on imports) is the single biggest sector risk β€” Indian generics account for ~40% of US volumes; duty would compress margins across every large-cap.
  • Concentrated CDMO client risk: Syngene ~40% revenue from BMS (even with 2035 extension); any BMS pipeline setback = immediate earnings hit β€” size position accordingly.
  • USFDA import alert cluster risk: a single Warning Letter at a major Sun/Cipla/Reddys facility freezes US approvals for 12-24 months β€” monitor inspection calendars closely.

02The demand engine

Where the demand comes from β€” the structural drivers pulling the sector's order books.
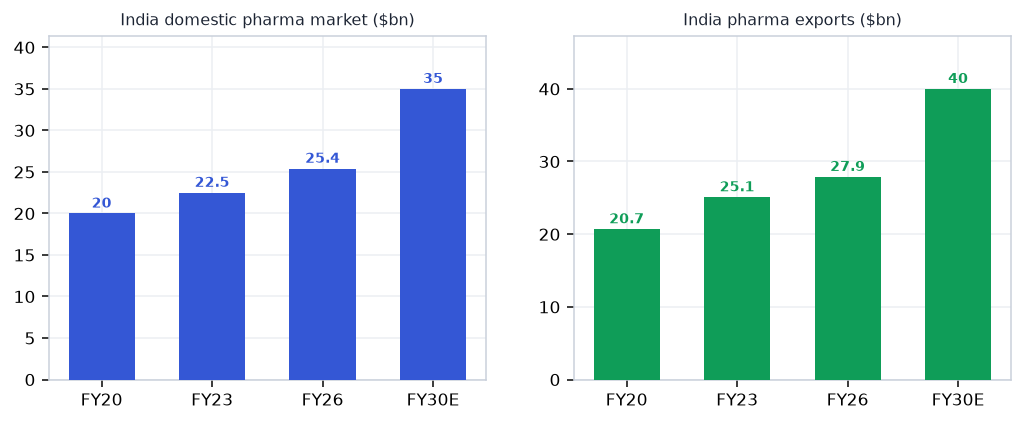
Pharma / CDMO demand drivers chart
Demand drivers. Source: government plans, company filings, industry estimates.
πŸ”’βœ¨

Unlock the full Pharma / CDMO report

8 more sections β€” the graded universe, scenario analysis, institutional flows and the downloadable fund-grade PDF.

Value chain & profit-pool economics
Catalyst & policy timeline
Institutional flow trends & top movers
Bull / base / bear scenarios
Every listed name, forensically graded
Downloadable fund-grade PDF

β‚Ή399/month Β· every sector report + Orion queries Β· cancel anytime Β· Already a member? Sign in

Frequently asked questions

How big is India's Pharma / CDMO opportunity in 2026?

India is the world's pharmacy β€” $31bn FY26 exports, 20% of global generic volumes β€” and the generics cash cow is… The key numbers that frame the sector: $31bn (India pharma exports FY26 (+2.1% YoY, 20% global generic share)); 3 OAIs (USFDA Official Action Indicated outcomes FY26 (down from 7 in FY25)); 13-15% CAGR (India CDMO market growth β€” $8.4bn (2024) β†’ $15.4bn (2029)); $60bn+ (Global biosimilar market opportunity by 2030); 30.3% (Sun Pharma FY26 EBITDA margin (specialty pivot delivering)). Together these define both the size of the Pharma / CDMO profit pool and the pace at which it is compounding β€” the full report maps where along the value chain that value actually lands.

What is driving growth in India's Pharma / CDMO sector?

US generics pricing reset is mostly done — marginal improvement + specialty mix-up positions Sun/Cipla for 200-300 bps EBITDA margin expansion FY27-28 from a clean base. China+1 CDMO outsourcing structurally accelerating ($8.4bn→$15.4bn by 2029 at 13-15% CAGR); Neuland and Syngene (BMS to 2035) are signing multi-year anchor deals NOW. GLP-1/peptide wave is the next leg — semaglutide biosimilar approved India Mar 2026; 7-10 brands by FY27; India CDMO is the natural manufacture-for-world hub on peptide capacity. Each of these drivers is tracked in the report's catalyst section with dated windows, so readers can verify whether the thesis is playing out on schedule.

What are the key risks in the India Pharma / CDMO sector?

US Section 232 pharma tariff (10-25% on imports) is the single biggest sector risk β€” Indian generics account for ~40% of US volumes; duty would compress margins across every large-cap. Concentrated CDMO client risk: Syngene ~40% revenue from BMS (even with 2035 extension); any BMS pipeline setback = immediate earnings hit β€” size position accordingly. USFDA import alert cluster risk: a single Warning Letter at a major Sun/Cipla/Reddys facility freezes US approvals for 12-24 months β€” monitor inspection calendars closely. The full report carries an eight-item risk register scored on likelihood and severity, plus a bear-case scenario that quantifies how these risks would transmit through each node of the value chain.

Which companies are covered in India's Pharma / CDMO sector report?

The report covers 28 listed companies across the full value chain (KSM & Raw Materials β†’ API Manufacturing β†’ Contract Services β†’ Formulations β†’ Specialty Segments), so upstream suppliers, manufacturers and downstream distribution are all graded on the same yardstick. Names screening strongest on this objective test currently include Glenmark Pharmaceuticals, Biocon, Syngene International, Aarti Drugs, Torrent Pharmaceuticals. Every company named in the report links to its live VestAI stock page, and the universe table lets readers sort the full list on valuation, returns and balance-sheet quality.

How does VestAI grade Pharma / CDMO companies?

Every name in the universe is graded on cash conversion β€” cumulative 3-year operating cash flow measured against reported profit. This is a data classification, not an opinion: the grade asks whether reported profits actually arrive as cash, which is where accounting-quality problems show up first. The same forensic yardstick is applied across all 30 VestAI sector reports, so a grade in Pharma / CDMO is directly comparable to a grade in any other sector β€” and grades refresh with each quarterly data update.

Where can I read VestAI's full Pharma / CDMO sector analysis?

The free version of this page includes the executive summary, key sector numbers, demand drivers, key risks and this FAQ β€” enough to understand how the Pharma / CDMO value chain earns its money. VestAI Pro and Max members unlock the full report: the complete value-chain map with node economics, dated recent developments, the catalyst tracker, competitive structure, the scenario matrix with per-node impacts, the graded 28-company universe with an interactive comparison table, and a downloadable 15-page PDF edition. Reports are rebuilt each quarter on fresh filings, and all content is educational research rather than investment advice.

VestAI Β· Orion Industry Research Β· Educational research β€” not investment advice
    India Pharma / CDMO Sector Analysis 2026 β€” Demand, Value Chain & Outlook | VestAI