India Paper & Packaging — sector deep-dive
Paper & packaging is two sectors wearing one label.
01Executive summary
Paper & packaging is two sectors wearing one label. The commodity half — writing & printing paper, virgin board, films — is under siege: imports surged 34% in FY24 (ASEAN +92%), China's Q1 FY26 shipments rose another 28%, and Indian mills carry a structural $70/MT wood-cost handicap against ASEAN's forest concessions. The result is visible carnage: Satia PAT −85%, Seshasayee −35%, Orient in a second straight loss, Andhra Paper's plant locked out since May. The specialty half never met an import: EPL (global #1 tubes) grew PAT +15% at a 20.2% margin, AGI Greenpac's glass near-duopoly compounds at 20-22% EBITDA, TCPL's carton PAT roughly doubled, Mold-Tek's pharma packs grew +209%. The swing is regulatory and dated: the DGTR recommended $261-376/MT anti-dumping duty on Indonesian board on June 25, 2026 (gazette pending), a W&P QCO sits with DPIIT, and the film glut gets no new capacity in FY27 — UFlex's 14-quarter-high Q4 margin says that trough is already turning.
Why now
- The protection wall is half-built and dated: DGTR's duty recommendation is done (Jun 25), the gazette notification is the imminent binary, and Q4 commentary across mills already cited reduced dumping and firmer pricing.
- The film cycle turns by starvation — 12 lines were added in two years, none arrive in FY27-28, and UFlex (15.3% Q4 margin, 14-quarter high) and Polyplex (Q4 PAT +145%) have already printed the inflection.
- EPR went live April 1, 2026 and recycled-content mandates rise to 60% by FY29 — format shifts toward fibre and away from single-use plastic reprice the whole specialty tier's growth.
Key risks
- The duty may not gazette, or gazette diluted — the sector's W&P and board economics are regulatory-contingent, and a delay extends the loss cycle for every sub-scale mill.
- Hardwood pulp at $615/MT can spike toward $700 on Indonesian licence revocations plus INR weakness — raw material is 45-50% of mill revenue.
- US/EU tariff walls against China/Indonesia can redirect even more volume to India faster than protection responds — the import wave is someone else's trade policy.
02The demand engine
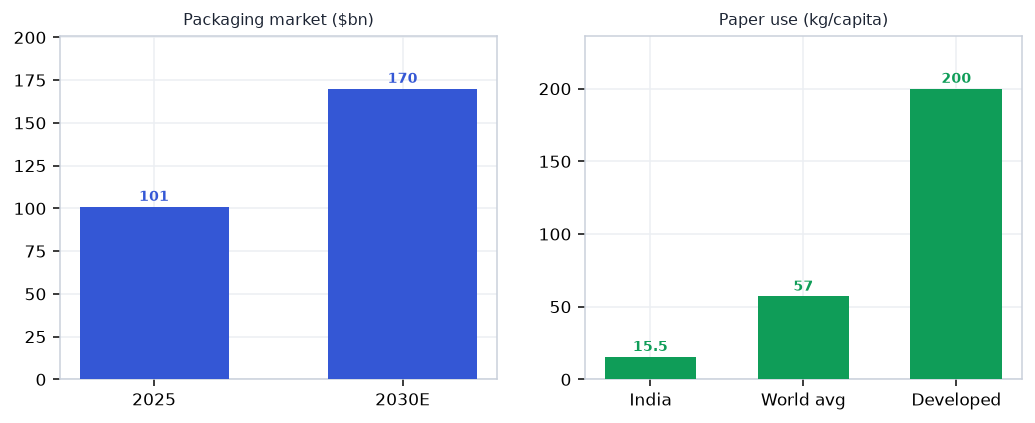
Where the demand comes from — the structural drivers pulling the sector's order books.
Unlock the full Paper & Packaging report
8 more sections — the graded universe, scenario analysis, institutional flows and the downloadable fund-grade PDF.
₹399/month · every sector report + Orion queries · cancel anytime · Already a member? Sign in
Frequently asked questions
How big is India's Paper & Packaging opportunity in 2026?
Paper & packaging is two sectors wearing one label. The key numbers that frame the sector: 15–16 kg vs 57 (India vs world per-capita paper — the runway); +34% / +92% (FY24 import surge, total / ASEAN — the siege); $261–376/MT (DGTR anti-dumping duty, Jun 25 2026 — gazette pending); $110 vs $40 (India vs ASEAN fibre cost per MT — the handicap); ~65% (BOPP utilisation — trough, with zero FY27 additions). On the demand side, FMCG share stands at ~45% — of packaging demand; premiumisation = loose → branded → premium formats. Together these define both the size of the Paper & Packaging profit pool and the pace at which it is compounding — the full report maps where along the value chain that value actually lands.
What is driving growth in India's Paper & Packaging sector?
The protection wall is half-built and dated: DGTR's duty recommendation is done (Jun 25), the gazette notification is the imminent binary, and Q4 commentary across mills already cited reduced dumping and firmer pricing. The film cycle turns by starvation — 12 lines were added in two years, none arrive in FY27-28, and UFlex (15.3% Q4 margin, 14-quarter high) and Polyplex (Q4 PAT +145%) have already printed the inflection. EPR went live April 1, 2026 and recycled-content mandates rise to 60% by FY29 — format shifts toward fibre and away from single-use plastic reprice the whole specialty tier's growth. Each of these drivers is tracked in the report's catalyst section with dated windows, so readers can verify whether the thesis is playing out on schedule.
What are the key risks in the India Paper & Packaging sector?
The duty may not gazette, or gazette diluted — the sector's W&P and board economics are regulatory-contingent, and a delay extends the loss cycle for every sub-scale mill. Hardwood pulp at $615/MT can spike toward $700 on Indonesian licence revocations plus INR weakness — raw material is 45-50% of mill revenue. US/EU tariff walls against China/Indonesia can redirect even more volume to India faster than protection responds — the import wave is someone else's trade policy. The full report carries an eight-item risk register scored on likelihood and severity, plus a bear-case scenario that quantifies how these risks would transmit through each node of the value chain.
Which companies are covered in India's Paper & Packaging sector report?
The report covers 18 listed companies across the full value chain (Raw material → Paper & board → Converting → Rigid & specialty → End demand), so upstream suppliers, manufacturers and downstream distribution are all graded on the same yardstick. Names screening strongest on this objective test currently include TNPL, Polyplex, Satia Industries, EPL (Essel Propack), Kuantum Papers. Every company named in the report links to its live VestAI stock page, and the universe table lets readers sort the full list on valuation, returns and balance-sheet quality.
How does VestAI grade Paper & Packaging companies?
Every name in the universe is graded on cash conversion — cumulative 3-year operating cash flow measured against reported profit. This is a data classification, not an opinion: the grade asks whether reported profits actually arrive as cash, which is where accounting-quality problems show up first. The same forensic yardstick is applied across all 30 VestAI sector reports, so a grade in Paper & Packaging is directly comparable to a grade in any other sector — and grades refresh with each quarterly data update.
Where can I read VestAI's full Paper & Packaging sector analysis?
The free version of this page includes the executive summary, key sector numbers, demand drivers, key risks and this FAQ — enough to understand how the Paper & Packaging value chain earns its money. VestAI Pro and Max members unlock the full report: the complete value-chain map with node economics, dated recent developments, the catalyst tracker, competitive structure, the scenario matrix with per-node impacts, the graded 18-company universe with an interactive comparison table, and a downloadable 15-page PDF edition. Reports are rebuilt each quarter on fresh filings, and all content is educational research rather than investment advice.
India's ₹25.7L cr power + transmission super-cycle through 2030 is structural — underwritten by peak-demand…
India's defence budget has crossed ₹6.81L cr in FY26 (FY27 BE ₹7.85L cr, +16%) with ₹1.86L cr capital outlay…
India ESDM market ₹3.1L cr (~$37bn) is tracking toward ₹7-8L cr by 2030, underpinned by a ₹1.91L cr PLI outlay…