India Media & Entertainment — sector deep-dive
India's ₹2.3L cr ($28bn) M&E industry is mid-reset — linear TV advertising is in secular decline (media FII…
01Executive summary
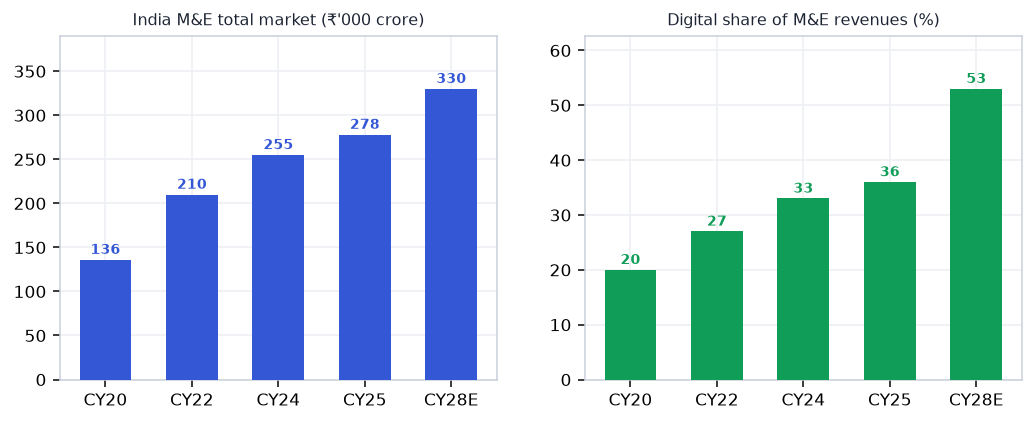
India's ₹2.3L cr ($28bn) M&E industry is mid-reset — linear TV advertising is in secular decline (media FII ownership down 7pp YoY) while digital OTT has crossed 50% of sector revenue with 200M+ subscribers. But the highest-quality profit pool is neither OTT nor linear: it is music IP ownership, where a catalogue created once monetises forever across streaming sync, licensing, and device hardware. Tips Music and Saregama — with 1.8L+ songs each, ~58% EBITDA margins, and zero debt — are the compounders the sector deserves. Bollywood box office remains structurally volatile (content-hit driven); gaming is nascent but fast; linear broadcast is a value-trap.
Why now
- India music streaming ARPU (₹40-50/month) is 5-8x below global average — any pricing normalisation is pure catalogue-royalty upside for Tips and Saregama with near-zero incremental cost (content already created).
- FII selling in linear TV has created indiscriminate sector-wide valuation compression — music-IP compounders are available at 25-30x FY27 PE vs 40x+ warranted by 20%+ earnings CAGR and ~58% EBITDA margins.
- Generative-AI content factories (video, reels, podcasts) are creating explosive new demand for licensed music beds — sync revenue is the next monetisation frontier for deep catalogues, and the TAM is just beginning to open.
Key risks
- Streaming platforms renegotiate royalty rates — any downward revision by Spotify/JioSaavn/YouTube compresses Tips and Saregama revenue directly; global music royalty disputes (US rate court precedent) are the key watch.
- Bollywood content-cycle miss — 3 consecutive ₹100 cr+ budget flops destroy multiplex economics (PVR Inox operating deleverage) and dampen OTT content spending budgets, reducing licensing demand for music IP.
- Online gaming 28% GST overhang — Rs 1.12L cr demand notices create binary regulatory risk for Nazara and the entire casual-gaming ecosystem; adverse Supreme Court ruling could stall sector growth for 2-3 years.
02The demand engine
Where the demand comes from — the structural drivers pulling the sector's order books.
Unlock the full Media & Entertainment report
8 more sections — the graded universe, scenario analysis, institutional flows and the downloadable fund-grade PDF.
₹399/month · every sector report + Orion queries · cancel anytime · Already a member? Sign in
Frequently asked questions
How big is India's Media & Entertainment opportunity?
India's ₹2.3L cr ($28bn) M&E industry is mid-reset — linear TV advertising is in secular decline (media FII… Key figures include $28bn → $43bn India M&E market FY26 → FY30 CAGR ~9% and 200M+ OTT subscribers in India (Jun 2026).
What is driving growth in India's Media & Entertainment sector?
India music streaming ARPU (₹40-50/month) is 5-8x below global average — any pricing normalisation is pure catalogue-royalty upside for Tips and Saregama with near-zero incremental cost (content already created).
What are the key risks in the India Media & Entertainment sector?
Streaming platforms renegotiate royalty rates — any downward revision by Spotify/JioSaavn/YouTube compresses Tips and Saregama revenue directly; global music royalty disputes (US rate court precedent) are the key watch. Bollywood content-cycle miss — 3 consecutive ₹100 cr+ budget flops destroy multiplex economics (PVR Inox operating deleverage) and dampen OTT content spending budgets, reducing licensing demand for music IP.
Where can I read VestAI's full analysis of the Media & Entertainment sector?
VestAI's full Media & Entertainment report covers every listed name with forensic screening, quality grades and scenario analysis — available to VestAI Pro and Max members.
India's ₹25.7L cr power + transmission super-cycle through 2030 is structural — underwritten by peak-demand…
India's defence budget has crossed ₹6.81L cr in FY26 (FY27 BE ₹7.85L cr, +16%) with ₹1.86L cr capital outlay…
India ESDM market ₹3.1L cr (~$37bn) is tracking toward ₹7-8L cr by 2030, underpinned by a ₹1.91L cr PLI outlay…