India IT Services — sector deep-dive
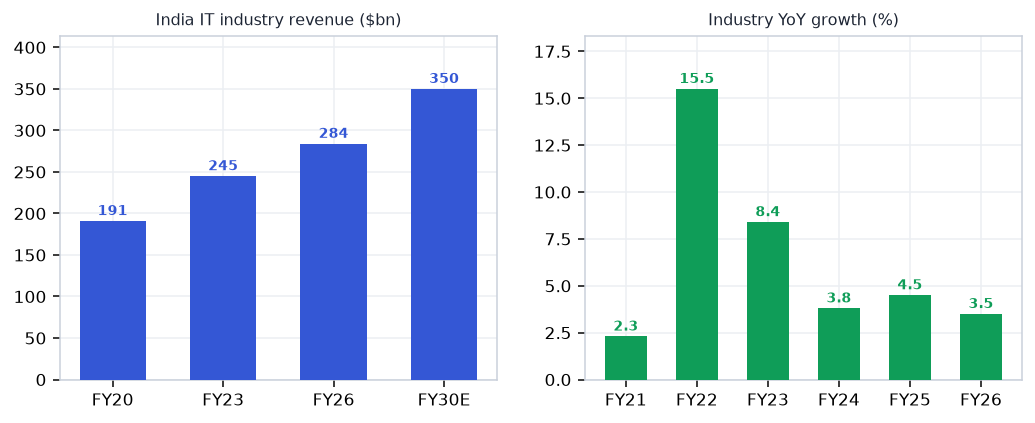
$284bn industry at a cyclical trough — FY26 USD growth ~3.5% (sharpest since COVID).
01Executive summary
$284bn industry at a cyclical trough — FY26 USD growth ~3.5% (sharpest since COVID). GenAI is compressing per-seat billing but simultaneously seeding a new wave of large AI-transformation deals (TCV ~$45bn pipeline). The reset separates durable profit pools (ER&D, vertical-platform software, IP-led) from structurally deflationary commoditised BPM and linear headcount plays. Big-3 margins holding 18-25% through the trough confirms structural resilience. The next 12-18 months are about deal-conversion velocity — those who convert TCV to revenue fastest win the re-rating.
Why now
- Valuation at trough: Nifty IT trades at ~23x forward (vs. 5yr avg 28x) — entering from compression rather than chasing expansion; risk/reward asymmetric to upside if FY27 recovers.
- Large deal TCV ~$45bn provides a visible demand pipeline — the question is timing not existence; any positive conversion signal in Jul-Oct results = meaningful re-rating catalyst.
- ER&D and IP-led plays (LTTS, Cyient, OFSS, Mphasis) are structurally insulated from GenAI commoditisation and growing faster than sector — quality at relative trough prices.
- Fed rate-cut cycle beginning in H2 2026 unlocks BFSI IT budgets (largest vertical for Indian IT) — historically a 2-3 quarter lag to revenue; set up now before the data confirms.
- GenAI is a net positive for differentiated players: large-scale transformation mandates need systems integrators and domain-specialists — exactly what Indian IT majors are; the fear of disintermediation is overpriced in current multiples.
Key risks
- US macro deterioration or prolonged rate-high scenario freezes discretionary IT budgets further — FY27 growth could stay sub-5% USD, killing the re-rating thesis; worst case is a US recession triggering deal cancellations (2001/2008 analogue).
- GenAI deflation accelerates faster than new deal ramp — if per-seat billing compression outpaces large-deal revenue recognition, margins compress 200bp+ and EPS estimates fall 10-15%; particularly acute risk for BPM-heavy and linear headcount players.
- Large deal TCV-to-revenue conversion slips (execution risk, client budget re-sequencing) — pipeline is healthy but if conversion lag extends beyond FY27 H1, consensus estimate cuts resume and the trough valuation becomes a value trap.
- INR appreciation (RBI easing + carry unwind) — every 1% INR strength vs USD compresses EBIT margin ~40-50bp for pure exporters; sharp move to sub-82 range would be meaningful.
- Concentration of US exposure (~55-65% revenue) means any US-specific shock (tariffs on services, visa restrictions, regulatory change) hits Indian IT disproportionately.
02The demand engine
Where the demand comes from — the structural drivers pulling the sector's order books.
Unlock the full IT Services report
8 more sections — the graded universe, scenario analysis, institutional flows and the downloadable fund-grade PDF.
₹399/month · every sector report + Orion queries · cancel anytime · Already a member? Sign in
Frequently asked questions
How big is India's IT Services opportunity?
$284bn industry at a cyclical trough — FY26 USD growth ~3.5% (sharpest since COVID). Key figures include $284bn Industry revenue FY26E and $217bn IT & BPM exports FY26E.
What is driving growth in India's IT Services sector?
Valuation at trough: Nifty IT trades at ~23x forward (vs. 5yr avg 28x) — entering from compression rather than chasing expansion; risk/reward asymmetric to upside if FY27 recovers.
What are the key risks in the India IT Services sector?
US macro deterioration or prolonged rate-high scenario freezes discretionary IT budgets further — FY27 growth could stay sub-5% USD, killing the re-rating thesis; worst case is a US recession triggering deal cancellations (2001/2008 analogue). GenAI deflation accelerates faster than new deal ramp — if per-seat billing compression outpaces large-deal revenue recognition, margins compress 200bp+ and EPS estimates fall 10-15%; particularly acute risk for BPM-heavy and linear headcount players.
Where can I read VestAI's full analysis of the IT Services sector?
VestAI's full IT Services report covers every listed name with forensic screening, quality grades and scenario analysis — available to VestAI Pro and Max members.
India's ₹25.7L cr power + transmission super-cycle through 2030 is structural — underwritten by peak-demand…
India's defence budget has crossed ₹6.81L cr in FY26 (FY27 BE ₹7.85L cr, +16%) with ₹1.86L cr capital outlay…
India ESDM market ₹3.1L cr (~$37bn) is tracking toward ₹7-8L cr by 2030, underpinned by a ₹1.91L cr PLI outlay…