India Infrastructure & EPC — sector deep-dive
The paradox of Indian infrastructure in 2026: the largest capex budget in history (₹12.2 lakh crore, +11.5%) sits…
01Executive summary
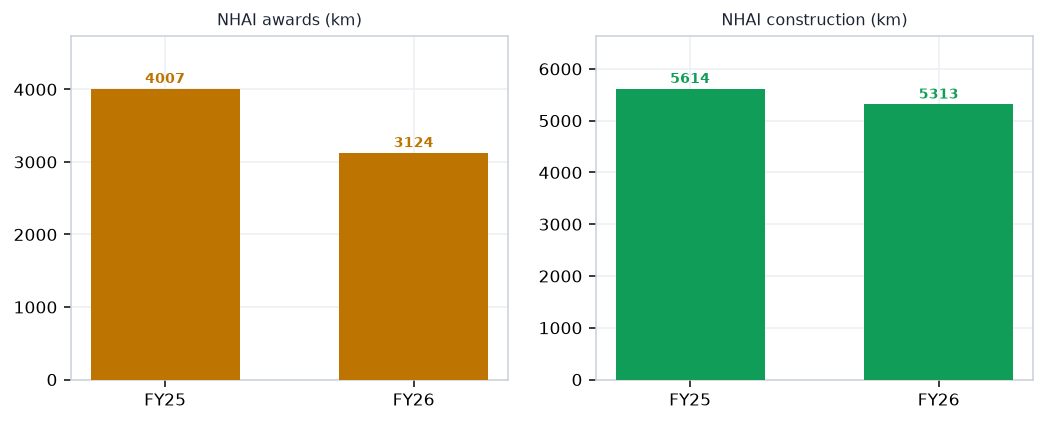
The paradox of Indian infrastructure in 2026: the largest capex budget in history (₹12.2 lakh crore, +11.5%) sits on top of a starving order pipeline. NHAI awarded 3,124 km in FY26 — a third straight weak year, 22% down, versus 5,313 km actually built — so the sector eats its backlog ~70% faster than it refills, with June 2026 producing 5 awarded km all month. Order books still read 3-4x sales, but the stress shows where it always does first: operating cash conversion collapsed below 30% (vs ~65% historical) and L1 bids run 26% below cost estimates. The feed data confirms it — GR Infra, KNR, HG Infra, AFCONS and EMS all carry negative 3-yr CFO/PAT. What still works: water (JJM restored to ₹67,670 cr and extended to 2028), metro/urban (₹3.44L cr sanctioned), buildings (real-estate cycle), tunnels, toll annuities (IRB InvIT at 85.5% EBITDA margin), and L&T's 52%-international escape velocity. The binary is one government decision: releasing Bharatmala's held-back 1,500-2,000 km from a ₹1.1 lakh crore bid pipeline that already exists.
Why now
- JJM 2.0 is approved (Cabinet, Mar 22, 2026), funded (₹67,670 cr vs ₹17,000 cr spent last year) and deadlined (Dec 2028) — state water boards must tender in H2 FY27, and the water-EPC order wave follows.
- The monetisation flywheel is finally public: NHAI's RIIT InvIT listed March 24, ₹28,307 cr recycled in FY26, Bundle 19 in evaluation — every rupee monetised is future awarding capacity.
- The bid pipeline (₹1.1L cr) and the BOT revival (26% of pipeline, highest in years) are loaded; the sector trades at bid-war multiples while the restart decision is a catalyst, not a hope.
Key risks
- A third year of frozen awarding turns the backlog math into falling FY28-29 revenue — Nuvama's July read is that FY27 brings no rebound; the bull case rests on one policy decision.
- The working-capital trap: OCF conversion below 30%, 27 rating actions in three months (negatives outnumbering positives), and MoRTH's Jan-26 circular removing default arbitration strands disputed claims.
- A steel/bitumen spike of 20%+ pushes L1-priced road books below water — cost overruns, stoppages and credit stress for the leveraged mid-tier.
02The demand engine
Where the demand comes from — the structural drivers pulling the sector's order books.
Unlock the full Infrastructure & EPC report
8 more sections — the graded universe, scenario analysis, institutional flows and the downloadable fund-grade PDF.
₹399/month · every sector report + Orion queries · cancel anytime · Already a member? Sign in
Frequently asked questions
How big is India's Infrastructure & EPC opportunity in 2026?
The paradox of Indian infrastructure in 2026: the largest capex budget in history (₹12.2 lakh crore, +11.5%) sits… The key numbers that frame the sector: ₹12.2L cr (FY27 central capex (+11.5%) — record); 3,124 vs 5,313 km (NHAI awarded vs built FY26 — backlog draining); <30% (Sector OCF conversion, vs ~65% historical); ₹67,670 cr (JJM FY27 restored (from ₹17,000 cr RE) — water wave); ₹1.1L cr (Jun-26 bid pipeline awaiting release). On the demand side, MoRTH FY27 stands at ₹3,09,875 cr — +8%; NHAI ₹1,87,293 cr (+10%) — flat-to-up, not stimulus. Together these define both the size of the Infrastructure & EPC profit pool and the pace at which it is compounding — the full report maps where along the value chain that value actually lands.
What is driving growth in India's Infrastructure & EPC sector?
JJM 2.0 is approved (Cabinet, Mar 22, 2026), funded (₹67,670 cr vs ₹17,000 cr spent last year) and deadlined (Dec 2028) — state water boards must tender in H2 FY27, and the water-EPC order wave follows. The monetisation flywheel is finally public: NHAI's RIIT InvIT listed March 24, ₹28,307 cr recycled in FY26, Bundle 19 in evaluation — every rupee monetised is future awarding capacity. The bid pipeline (₹1.1L cr) and the BOT revival (26% of pipeline, highest in years) are loaded; the sector trades at bid-war multiples while the restart decision is a catalyst, not a hope. Each of these drivers is tracked in the report's catalyst section with dated windows, so readers can verify whether the thesis is playing out on schedule.
What are the key risks in the India Infrastructure & EPC sector?
A third year of frozen awarding turns the backlog math into falling FY28-29 revenue — Nuvama's July read is that FY27 brings no rebound; the bull case rests on one policy decision. The working-capital trap: OCF conversion below 30%, 27 rating actions in three months (negatives outnumbering positives), and MoRTH's Jan-26 circular removing default arbitration strands disputed claims. A steel/bitumen spike of 20%+ pushes L1-priced road books below water — cost overruns, stoppages and credit stress for the leveraged mid-tier. The full report carries an eight-item risk register scored on likelihood and severity, plus a bear-case scenario that quantifies how these risks would transmit through each node of the value chain.
Which companies are covered in India's Infrastructure & EPC sector report?
The report covers 20 listed companies across the full value chain (Funding → Development → EPC contractors → Sub-contract & inputs → End demand), so upstream suppliers, manufacturers and downstream distribution are all graded on the same yardstick. Names screening strongest on this objective test currently include Patel Engineering, PNC Infratech, J Kumar Infraprojects, Ahluwalia Contracts, Larsen & Toubro. Every company named in the report links to its live VestAI stock page, and the universe table lets readers sort the full list on valuation, returns and balance-sheet quality.
How does VestAI grade Infrastructure & EPC companies?
Every name in the universe is graded on cash conversion — cumulative 3-year operating cash flow measured against reported profit. This is a data classification, not an opinion: the grade asks whether reported profits actually arrive as cash, which is where accounting-quality problems show up first. The same forensic yardstick is applied across all 30 VestAI sector reports, so a grade in Infrastructure & EPC is directly comparable to a grade in any other sector — and grades refresh with each quarterly data update.
Where can I read VestAI's full Infrastructure & EPC sector analysis?
The free version of this page includes the executive summary, key sector numbers, demand drivers, key risks and this FAQ — enough to understand how the Infrastructure & EPC value chain earns its money. VestAI Pro and Max members unlock the full report: the complete value-chain map with node economics, dated recent developments, the catalyst tracker, competitive structure, the scenario matrix with per-node impacts, the graded 20-company universe with an interactive comparison table, and a downloadable 15-page PDF edition. Reports are rebuilt each quarter on fresh filings, and all content is educational research rather than investment advice.
India's ₹25.7L cr power + transmission super-cycle through 2030 is structural — underwritten by peak-demand…
India's defence budget has crossed ₹6.81L cr in FY26 (FY27 BE ₹7.85L cr, +16%) with ₹1.86L cr capital outlay…
India ESDM market ₹3.1L cr (~$37bn) is tracking toward ₹7-8L cr by 2030, underpinned by a ₹1.91L cr PLI outlay…