India Healthcare Services — sector deep-dive
India's healthcare delivery market — ₹6.3L cr in FY24, compounding 11–12% toward ₹9.4–9.8L cr by FY28 — sits on a…
01Executive summary
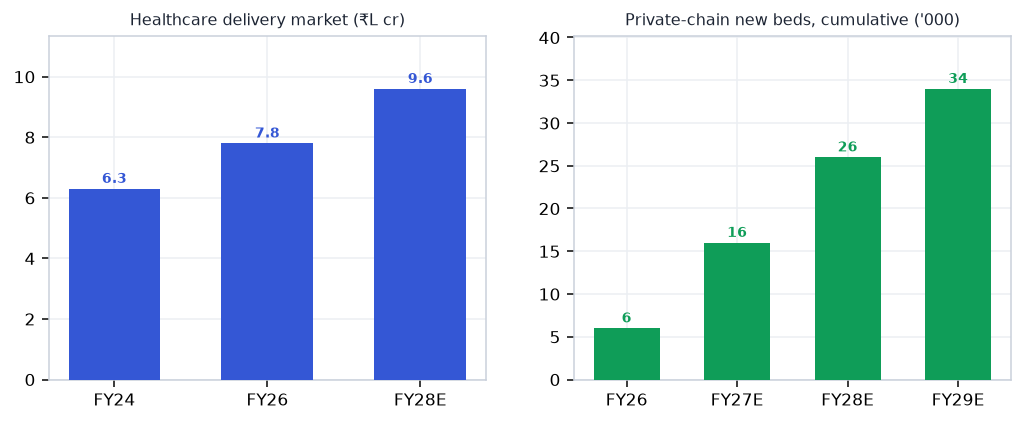
India's healthcare delivery market — ₹6.3L cr in FY24, compounding 11–12% toward ₹9.4–9.8L cr by FY28 — sits on a structural mismatch: 1.3 hospital beds per 1,000 people against WHO's 3.0. Private chains are answering with the largest capex cycle in sector history (₹40,000 cr, 34,000 beds by FY29) while insurance underwrites the demand: GST on individual health policies cut to zero (Sep 2025), 41 cr+ Ayushman cards, retail health GWP growing 25–35%. Profit pools concentrate where pricing power lives — metro hospitals compounding ARPOB at 6–12%, single-specialty chains growing 22%, and B2C diagnostics at 25–40% margins post price-war. The near-term catch: new beds dilute margins for 2–3 years, and the clinical-talent shortage makes occupancy ramp the most uncertain variable in every expansion model.
Why now
- GST on individual health insurance went to ZERO on Sep 22, 2025 — an effective 18% price cut for ~2.7 cr retail policyholders; retail health GWP is compounding 25–35% (Niva Bupa retail +35% FY26).
- FY26 results proved the operating model: Max ARPOB ₹77.8k/day (sector best), Fortis hospital margin 22.2% (from 20.5%), Thyrocare PAT +81% — pricing power is back across hospitals AND diagnostics.
- The ₹40,000 cr / 34,000-bed private capex cycle (38–40% into Tier-2/3) is committed and funded — revenue visibility for the build-out chain from 2026 through FY29
Key risks
- New-bed commissioning concentrates in FY27–28 — hospitals take 3–5 years to EBITDA breakeven, so sector margins dilute mechanically during the ramp window.
- CGHS revised room rates (Oct 2025) but left surgical/diagnostic package rates unchanged since 2014 — chains with heavy govt-scheme mix face a chronic reimbursement squeeze.
- Clinical talent is the binding constraint: ~6.1 doctors/10,000 (a quarter of WHO norms) — Tier-2 greenfields face 12–24-month staffing lags that no capex can compress.
02The demand engine
Where the demand comes from — the structural drivers pulling the sector's order books.
Unlock the full Healthcare Services report
8 more sections — the graded universe, scenario analysis, institutional flows and the downloadable fund-grade PDF.
₹399/month · every sector report + Orion queries · cancel anytime · Already a member? Sign in
Frequently asked questions
How big is India's Healthcare Services opportunity?
India's healthcare delivery market — ₹6.3L cr in FY24, compounding 11–12% toward ₹9.4–9.8L cr by FY28 — sits on a… Key figures include ₹6.3L cr Healthcare delivery market FY24 → ₹9.6L cr FY28E and 1.3 vs 3.0 India hospital beds/1,000 vs WHO norm.
What is driving growth in India's Healthcare Services sector?
GST on individual health insurance went to ZERO on Sep 22, 2025 — an effective 18% price cut for ~2.7 cr retail policyholders; retail health GWP is compounding 25–35% (Niva Bupa retail +35% FY26).
What are the key risks in the India Healthcare Services sector?
New-bed commissioning concentrates in FY27–28 — hospitals take 3–5 years to EBITDA breakeven, so sector margins dilute mechanically during the ramp window. CGHS revised room rates (Oct 2025) but left surgical/diagnostic package rates unchanged since 2014 — chains with heavy govt-scheme mix face a chronic reimbursement squeeze.
Where can I read VestAI's full analysis of the Healthcare Services sector?
VestAI's full Healthcare Services report covers every listed name with forensic screening, quality grades and scenario analysis — available to VestAI Pro and Max members.
India's ₹25.7L cr power + transmission super-cycle through 2030 is structural — underwritten by peak-demand…
India's defence budget has crossed ₹6.81L cr in FY26 (FY27 BE ₹7.85L cr, +16%) with ₹1.86L cr capital outlay…
India ESDM market ₹3.1L cr (~$37bn) is tracking toward ₹7-8L cr by 2030, underpinned by a ₹1.91L cr PLI outlay…