India Consumer Durables — sector deep-dive
India's consumer durables and electricals sector is at the intersection of two durable structural tailwinds — a…
01Executive summary
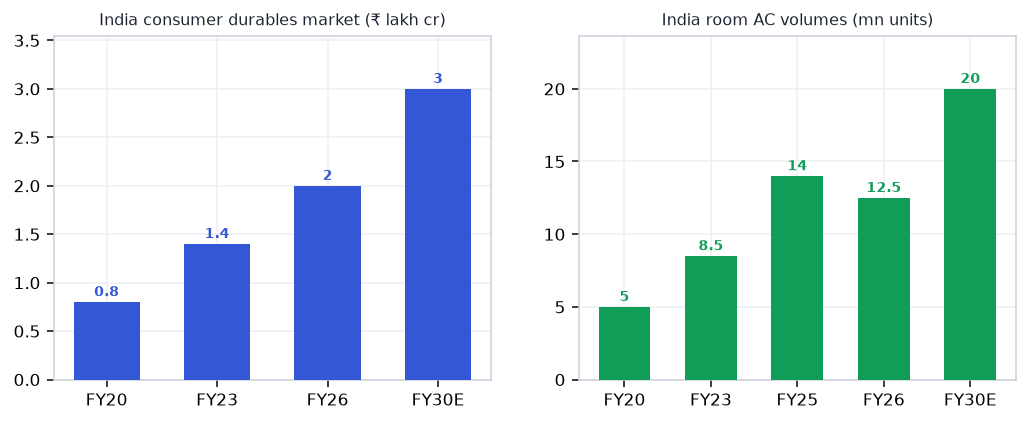
India's consumer durables and electricals sector is at the intersection of two durable structural tailwinds — a once-in-a-generation wires & cables upcycle (power infra + real estate pulling organised players to ₹1L cr in cables alone) and the early innings of a cooling revolution (8–12% AC penetration vs 100% in Japan/US, a decadal growth runway). The Apr–May 2026 heatwave crystallised the FY27 demand inflection: AC volumes surged 25–35% YoY, with Godrej reporting AC sales doubling in May. Polycab posted a record FY26 (₹28,884 cr +29%, market share 30–31%, net cash ₹4,000+ cr) and KEI delivered ₹11,746 cr +20.7% debt-free. Premiumisation is real — TTK Prestige PAT +45%, Hawkins +14.4% on pricing discipline, kitchen brands compounding 9–12% annually. New BEE norms (Jan 2026) and BIS import curbs structurally advantage organised/premium franchises.
Why now
- AC penetration at 8–12% vs 100% in Japan/US — the heatwave-triggered FY27 demand inflection is real but the decade-long structural runway is the bigger conviction.
- Wires & cables structurally immune to weather: RDSS, PMAY, data-centre and industrial capex sustain 15–18% volume compounding for Polycab and KEI through FY29
- BEE norms (Jan 2026) + BIS import curbs shift the AC/appliance market to organised premium brands, lifting ASPs and crowding out low-cost Chinese imports structurally.
Key risks
- Monsoon timing risk: early or heavy monsoon erases AC and cooler demand in H2 FY27 — pure-play cooling OEMs (Voltas PAT −56% FY26 mild-summer precedent) are highly seasonal.
- Dixon EMS backward integration into ACs, refrigerators at scale could compress EBITDA margins for mid-tier branded OEMs over a 2–3 year horizon.
- Copper and aluminium price volatility: a 10–15% spike in base metals compresses Polycab/KEI EBITDA by 100–150 bps — watch LME prices and hedging disclosures quarterly.
02The demand engine
Where the demand comes from — the structural drivers pulling the sector's order books.
Unlock the full Consumer Durables report
8 more sections — the graded universe, scenario analysis, institutional flows and the downloadable fund-grade PDF.
₹399/month · every sector report + Orion queries · cancel anytime · Already a member? Sign in
Frequently asked questions
How big is India's Consumer Durables opportunity?
India's consumer durables and electricals sector is at the intersection of two durable structural tailwinds — a… Key figures include ₹2L cr+ Consumer durables & electricals market FY26 and 8–12% India room AC household penetration (vs 100% Japan/US).
What is driving growth in India's Consumer Durables sector?
AC penetration at 8–12% vs 100% in Japan/US — the heatwave-triggered FY27 demand inflection is real but the decade-long structural runway is the bigger conviction.
What are the key risks in the India Consumer Durables sector?
Monsoon timing risk: early or heavy monsoon erases AC and cooler demand in H2 FY27 — pure-play cooling OEMs (Voltas PAT −56% FY26 mild-summer precedent) are highly seasonal. Dixon EMS backward integration into ACs, refrigerators at scale could compress EBITDA margins for mid-tier branded OEMs over a 2–3 year horizon.
Where can I read VestAI's full analysis of the Consumer Durables sector?
VestAI's full Consumer Durables report covers every listed name with forensic screening, quality grades and scenario analysis — available to VestAI Pro and Max members.
India's ₹25.7L cr power + transmission super-cycle through 2030 is structural — underwritten by peak-demand…
India's defence budget has crossed ₹6.81L cr in FY26 (FY27 BE ₹7.85L cr, +16%) with ₹1.86L cr capital outlay…
India ESDM market ₹3.1L cr (~$37bn) is tracking toward ₹7-8L cr by 2030, underpinned by a ₹1.91L cr PLI outlay…