India Cement & Materials — sector deep-dive
India cement crossed ~490 MT in FY26 (+9% YoY) — its largest demand year on record — while the sector's most…
01Executive summary
India cement crossed ~490 MT in FY26 (+9% YoY) — its largest demand year on record — while the sector's most dramatic consolidation in a decade concentrated ~47% of the 660 MTPA installed base in two groups: UltraTech (200 MTPA, EBITDA ₹17,598 cr +32%) and Adani/Ambuja (109 MTPA, volume 73.7 MT record, EBITDA +31%). Together they are exercising pricing discipline at ₹345/bag (+2% YoY) for the first time even as the largest new-capacity wave since 2013 (160-170 MT, FY26-28) tests their resolve. The durable profit pool sits in scale cement's cost curve + branded building materials: Pidilite's Fevicol near-monopoly (70% adhesives share, 24% EBITDA), Astral/Supreme's branded CPVC duopoly (17% EBITDA, JJM+housing tailwinds), and Kajaria's tiles leadership (PAT +65%, EBITDA ~19% post Morbi gas normalisation).
Why now
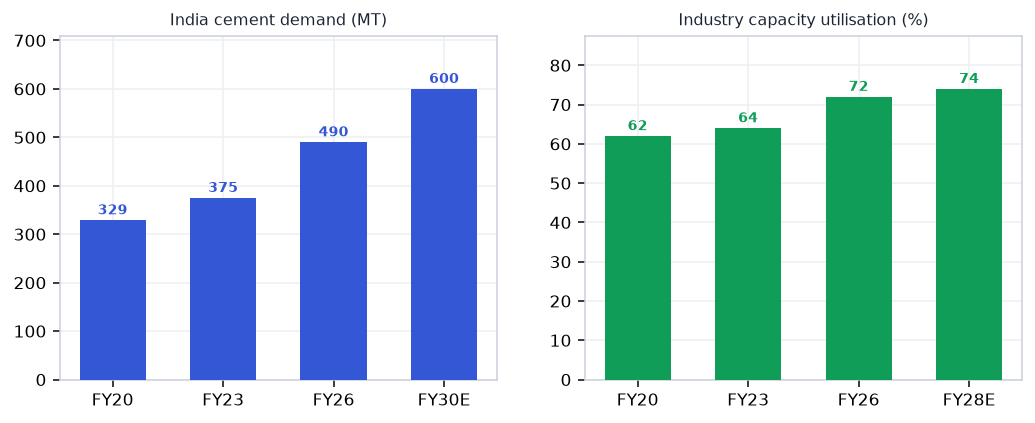
- India cement demand hit a record ~490 MT in FY26 (+9%) — housing upcycle and government infra spend are structural, not cyclical; PM Awas Urban 2.0 (1 cr homes) + JJM Phase 2 extend the demand runway to FY28-29 without needing GDP acceleration.
- Consolidation is structurally de-risking the sector — UltraTech + Adani controlling ~47% of capacity is producing the first real pricing discipline cycle (₹345/bag +2% even under new supply); scale leaders now compound earnings, not just volume.
- Building materials brand-moat compounders (Pidilite 24% EBITDA, Astral 17%, Kajaria 19% post-Morbi) are delivering FY26 earnings beats that validate the premiumisation thesis — these are defensible margins, not cyclical recovery peaks.
Key risks
- 160-170 MT new cement capacity (FY26-28) is the biggest supply wave since 2013 — if UltraTech/Adani chase volume over price, sector EBITDA/tonne collapses and regional cement stocks (Nuvoco, Birla Corp, India Cements) face 30-40% downside; even UltraTech de-rates.
- PVC resin price spike — commodity pipes (Finolex, Prince, Apollo) have zero pricing power to absorb feedstock moves; Apollo Pipe EBITDA already -30% in FY26 on PVC swing; watch for contagion risk if resin supply tightens from global petrochemical cycle.
- Morbi gas cost reversal is the single biggest swing for tiles — Kajaria's 19% EBITDA (FY26 recovery) reverts to 11-13% if Morbi cluster gas prices spike; monitor quarterly; full premium valuation leaves zero buffer for a margin miss.
02The demand engine
Where the demand comes from — the structural drivers pulling the sector's order books.
Unlock the full Cement & Materials report
8 more sections — the graded universe, scenario analysis, institutional flows and the downloadable fund-grade PDF.
₹399/month · every sector report + Orion queries · cancel anytime · Already a member? Sign in
Frequently asked questions
How big is India's Cement & Materials opportunity?
India cement crossed ~490 MT in FY26 (+9% YoY) — its largest demand year on record — while the sector's most… Key figures include ~490 MT Cement demand FY26 (+9% YoY, record) and ~660 MTPA Industry capacity; ~72% utilisation FY26.
What is driving growth in India's Cement & Materials sector?
India cement demand hit a record ~490 MT in FY26 (+9%) — housing upcycle and government infra spend are structural, not cyclical; PM Awas Urban 2.0 (1 cr homes) + JJM Phase 2 extend the demand runway to FY28-29 without needing GDP acceleration.
What are the key risks in the India Cement & Materials sector?
160-170 MT new cement capacity (FY26-28) is the biggest supply wave since 2013 — if UltraTech/Adani chase volume over price, sector EBITDA/tonne collapses and regional cement stocks (Nuvoco, Birla Corp, India Cements) face 30-40% downside; even UltraTech de-rates. PVC resin price spike — commodity pipes (Finolex, Prince, Apollo) have zero pricing power to absorb feedstock moves; Apollo Pipe EBITDA already -30% in FY26 on PVC swing; watch for contagion risk if resin supply tightens from global petrochemical cycle.
Where can I read VestAI's full analysis of the Cement & Materials sector?
VestAI's full Cement & Materials report covers every listed name with forensic screening, quality grades and scenario analysis — available to VestAI Pro and Max members.
India's ₹25.7L cr power + transmission super-cycle through 2030 is structural — underwritten by peak-demand…
India's defence budget has crossed ₹6.81L cr in FY26 (FY27 BE ₹7.85L cr, +16%) with ₹1.86L cr capital outlay…
India ESDM market ₹3.1L cr (~$37bn) is tracking toward ₹7-8L cr by 2030, underpinned by a ₹1.91L cr PLI outlay…