India Auto & EV — sector deep-dive
India's auto industry posted an all-time record 2.83 crore vehicles in FY26 (+10.4%), driven by premiumisation —…
01Executive summary
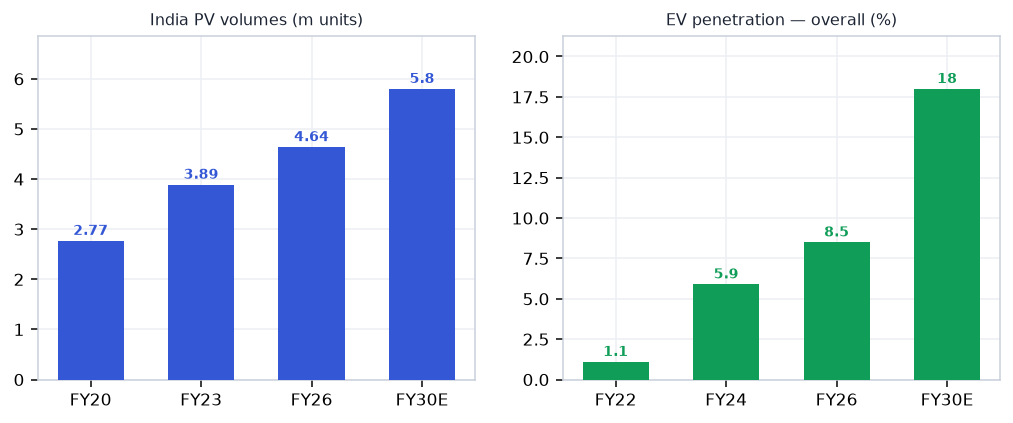
India's auto industry posted an all-time record 2.83 crore vehicles in FY26 (+10.4%), driven by premiumisation — SUVs/UVs crossed 65% of PV mix — and an export surge (+24% to 66.5 lakh units). EV penetration reached 8.5% overall, with 2W now touching 9%+ monthly. The durable profit pool resides in net-cash premium OEM franchises (M&M SUV dominance, Royal Enfield 25%+ EBITDA) and high-precision EV-adjacent components (Sona BLW ~24% EBITDA, Schaeffler, branded tyres) that gain content-per-vehicle as electrification deepens. The structural risk is a 30-40% ICE bill-of-material shrink per vehicle — pure-play ICE ancillaries without an EV pivot face earnings pressure over FY27-30.
Why now
- EV 2W penetration crossed 9% monthly for the first time in May 2026 — the structural inflection is happening now, not 3 years away; component winners (Sona BLW, Schaeffler) are already booking EV BEV revenue at 39-47% YoY growth.
- Premiumisation at an undeniable peak: SUV/UV mix 65%+ of PV volumes and rising; M&M +35% PAT, Royal Enfield record 1.23M units — content-per-vehicle lift drives OEM margin expansion that consensus underestimates for FY27-28
- Auto exports at a structural record ($21bn FY26, +24%) driven by 2W and components — China+1 supply-chain shift is funnelling Tier-1 global OEM orders to Indian precision component makers; Sona BLW's 3 European EV driveline wins in a single quarter confirm this.
Key risks
- ICE BOM shrink risk is a slow-moving but irreversible threat — pure-play ICE ancillaries (castings, plain forgings, fuel systems) face 30-40% content loss per vehicle as EV mix rises above 20%; high-PE names without EV pivot will de-rate 2-3 years before earnings hit.
- EV 2W market leadership is still fluid — Ola Electric down 20% YoY in May 2026 while TVS and Bajaj surged; OEM-specific EV bets carry platform-obsolescence risk if market consolidation is faster than expected.
- Global export demand fragility — India's 2W and component export surge is partly inventory-restocking driven; US auto tariff escalation or EU recession would hit Sona BLW, Endurance, and Schaeffler India disproportionately given their European OEM customer mix.
02The demand engine
Where the demand comes from — the structural drivers pulling the sector's order books.
Unlock the full Auto & EV report
8 more sections — the graded universe, scenario analysis, institutional flows and the downloadable fund-grade PDF.
₹399/month · every sector report + Orion queries · cancel anytime · Already a member? Sign in
Frequently asked questions
How big is India's Auto & EV opportunity?
India's auto industry posted an all-time record 2.83 crore vehicles in FY26 (+10.4%), driven by premiumisation —… Key figures include 2.83 cr FY26 total vehicle production — all-time record (+10.4% YoY) and 46.4L units PV volumes FY26 (+8%); SUV/UV mix 65%+ — premiumisation peak.
What is driving growth in India's Auto & EV sector?
EV 2W penetration crossed 9% monthly for the first time in May 2026 — the structural inflection is happening now, not 3 years away; component winners (Sona BLW, Schaeffler) are already booking EV BEV revenue at 39-47% YoY growth.
What are the key risks in the India Auto & EV sector?
ICE BOM shrink risk is a slow-moving but irreversible threat — pure-play ICE ancillaries (castings, plain forgings, fuel systems) face 30-40% content loss per vehicle as EV mix rises above 20%; high-PE names without EV pivot will de-rate 2-3 years before earnings hit. EV 2W market leadership is still fluid — Ola Electric down 20% YoY in May 2026 while TVS and Bajaj surged; OEM-specific EV bets carry platform-obsolescence risk if market consolidation is faster than expected.
Where can I read VestAI's full analysis of the Auto & EV sector?
VestAI's full Auto & EV report covers every listed name with forensic screening, quality grades and scenario analysis — available to VestAI Pro and Max members.
India's ₹25.7L cr power + transmission super-cycle through 2030 is structural — underwritten by peak-demand…
India's defence budget has crossed ₹6.81L cr in FY26 (FY27 BE ₹7.85L cr, +16%) with ₹1.86L cr capital outlay…
India ESDM market ₹3.1L cr (~$37bn) is tracking toward ₹7-8L cr by 2030, underpinned by a ₹1.91L cr PLI outlay…