India Agri / Fertilizers — sector deep-dive
India's ~$370bn agri market hosts three structurally distinct profit pools.
01Executive summary
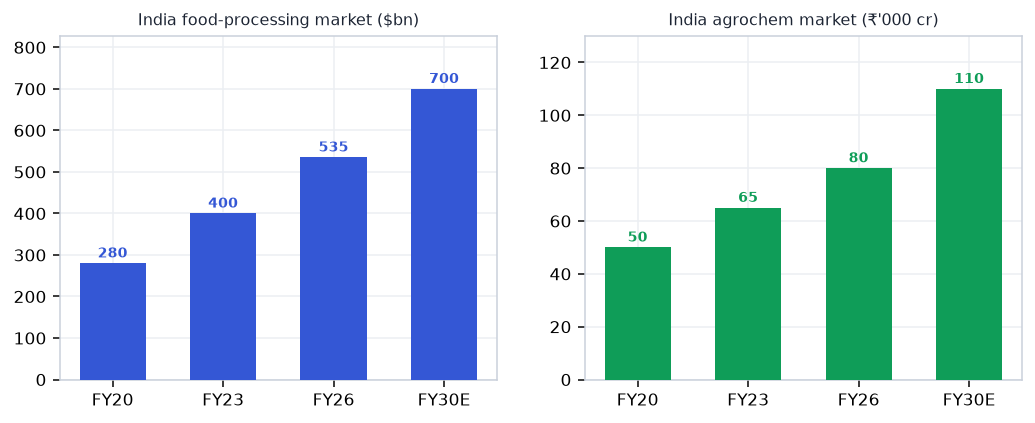
India's ~$370bn agri market hosts three structurally distinct profit pools. Crop-protection chemicals are recovering after a brutal two-year destocking cycle — agrochem market FY26 ~₹80,000 crore ($9.6bn) with exports $3.3bn growing at +15% CAGR on accelerating China+1 supply-chain diversification. Phosphatic fertilisers (Coromandel, Paradeep Phosphates) are benefiting from NBS subsidy rationalisation and backward integration into phosphoric acid / SSP, shielding margins from global DAP price swings. PI Industries is the sector's highest-conviction compounder — its NCE Pioxaniliprole commercial launch in FY27 marks India's first domestically-discovered new crop-protection molecule; net cash ₹3,427 crore and 25% EBITDA underpin quality. MNC-IP agrochemists (Bayer CropScience, Sumitomo Chemical) enjoy parent registration advantages, stable PBT growth, and clean balance sheets. Branded food and dairy (LT Foods/Daawat, Hatsun Agro) are premiumising on rising rural incomes and modern-trade penetration — basmati exports topped $5bn and South India's dairy formalisation accelerates Hatsun's structural compounding. The swing risk: monsoon 2026 ran 46% below normal through June 20 (IMD 90% LPA) — H1 FY27 kharif sowing volumes and rural demand are the key watchpoints.
Why now
- Agrochem channel destocking is completing after two years — PI Industries' CSM book at $1.8bn and first NCE Pioxaniliprole FY27 launch make this the earnings inflection year for India's highest-quality crop-protection compounder.
- NBS subsidy rationalisation is protecting P&K fertiliser margins while Coromandel and Paradeep Phosphates' backward phosphoric-acid integration shields them from global DAP price swings — EBITDA visibility is unusually high for a commodity-adjacent sector.
- Branded food premiumisation (LT Foods/Daawat basmati +29%, Hatsun dairy expansion) gives the sector a rural-consumption compounder that is structurally decoupled from agri-input volatility and benefits from rising per-capita food spending in India.
Key risks
- Monsoon 2026 disappointment below 85% LPA — kharif sowing falls, agri-input volumes compress for H1 FY27, and rural FMCG sentiment weakens; Coromandel, PI, Dhanuka all exposed to demand-side miss if June deficit does not reverse by August.
- NBS subsidy cuts or DAP price decline — reduces Coromandel and Paradeep Phosphates per-tonne margins; any government move to rationalise NBS rates downward is a direct earnings risk; global phosphate oversupply from Morocco/China amplifies this.
- PI Industries NCE Pioxaniliprole launch delays or lower-than-expected volumes — the stock's premium valuation (~38-40x PE) is partly pricing in the NCE revenue; regulatory or formulation delays push re-rating to FY28 and create a de-rating risk.
02The demand engine
Where the demand comes from — the structural drivers pulling the sector's order books.
Unlock the full Agri / Fertilizers report
8 more sections — the graded universe, scenario analysis, institutional flows and the downloadable fund-grade PDF.
₹399/month · every sector report + Orion queries · cancel anytime · Already a member? Sign in
Frequently asked questions
How big is India's Agri / Fertilizers opportunity?
India's ~$370bn agri market hosts three structurally distinct profit pools. Key figures include ~$370bn India agri market size — the scale backdrop for all input and food plays and ~₹80,000 cr India crop-protection market FY26 (~$9.6bn); exports $3.3bn at +15% CAGR.
What is driving growth in India's Agri / Fertilizers sector?
Agrochem channel destocking is completing after two years — PI Industries' CSM book at $1.8bn and first NCE Pioxaniliprole FY27 launch make this the earnings inflection year for India's highest-quality crop-protection compounder.
What are the key risks in the India Agri / Fertilizers sector?
Monsoon 2026 disappointment below 85% LPA — kharif sowing falls, agri-input volumes compress for H1 FY27, and rural FMCG sentiment weakens; Coromandel, PI, Dhanuka all exposed to demand-side miss if June deficit does not reverse by August. NBS subsidy cuts or DAP price decline — reduces Coromandel and Paradeep Phosphates per-tonne margins; any government move to rationalise NBS rates downward is a direct earnings risk; global phosphate oversupply from Morocco/China amplifies this.
Where can I read VestAI's full analysis of the Agri / Fertilizers sector?
VestAI's full Agri / Fertilizers report covers every listed name with forensic screening, quality grades and scenario analysis — available to VestAI Pro and Max members.
India's ₹25.7L cr power + transmission super-cycle through 2030 is structural — underwritten by peak-demand…
India's defence budget has crossed ₹6.81L cr in FY26 (FY27 BE ₹7.85L cr, +16%) with ₹1.86L cr capital outlay…
India ESDM market ₹3.1L cr (~$37bn) is tracking toward ₹7-8L cr by 2030, underpinned by a ₹1.91L cr PLI outlay…